Executive Summary
Ports face three relentless water challenges: larger ships requiring deeper, better-characterized channels; continuous siltation that demands perpetual maintenance dredging; and tightening environmental regulation of dredging operations. Acoustic Doppler Current Profilers (ADCPs) are the single instrument class that serves all three — measuring the currents that drive sediment movement, tracking the plumes that dredging creates, and delivering the real-time flow data that pilots use to navigate safely.
This guide covers the three core port applications of ADCP monitoring — dredging plume compliance, navigation safety, and siltation management — with calibration methodology, PIANC regulatory alignment, operational case studies from eight ports worldwide, and an equipment selection matrix.
Table of Contents
- Introduction: The Three Water Problems of Modern Ports
- Dredging Operations: Plume Monitoring and Compliance
- Navigation Safety: Real-Time Currents for Pilots and VTS
- Siltation Monitoring: Predicting Where Sediment Will Go
- Equipment Selection for Port Monitoring
- Implementation Roadmap
- Frequently Asked Questions
- Conclusion
1. Introduction: The Three Water Problems of Modern Ports
Over 80% of world trade moves by sea, and the vessels carrying it keep growing: ultra-large container ships now exceed 20,000 TEUs and require channel drafts of 15–20 meters. This creates three interconnected water challenges for every major port:
- The capacity problem: Channels designed for yesterday’s vessels must be deepened and widened — a $12.84 billion global dredging market in 2024, projected to grow 4.4–4.6% annually through 2029. Within that market, maintenance dredging — the perpetual battle against natural siltation — represents roughly half of all dredging value.
- The safety problem: Larger vessels have less margin for error. A Panamax carrier drawing 12 meters in a channel with 8 meters of tidal range needs precise, real-time knowledge of currents and water levels. NOAA’s PORTS® program quantifies the value: ports with real-time environmental data document a 50% reduction in maritime accidents.
- The environmental problem: Dredging resuspends sediment. Regulators from the U.S. Army Corps of Engineers to European port authorities now require real-time plume monitoring to protect seagrass meadows, coral reefs, and spawning habitats. The PIANC EnviCom WG 157 guidelines (2023) formalize this into spill budgets, tiered response protocols, and mandatory compliance monitoring.
The common thread running through all three problems is water movement. Currents transport the sediment that silts channels. Currents disperse or concentrate the plumes that dredging creates. Currents determine whether a deep-draft vessel berths safely on a given tide. And the only instrument class that measures currents across the full water column — in real time, continuously, at regulatory-grade accuracy — is the ADCP.
2. Dredging Operations: Plume Monitoring and Compliance
Dredging plume monitoring is the most mature and most regulated ADCP application in the port environment. When a dredger operates, it inevitably resuspends sediment — and the regulatory question is always the same: how far does the plume travel, at what concentration, and does it cross the mixing zone boundary?
2.1 Why Plume Monitoring Matters: The PIANC Framework
The PIANC EnviCom Working Group 157 guidelines (October 2023) — “Environmental Aspects of Dredging, Port and Waterway Construction around Coastal Plant Habitats” — provide the current international best-practice framework for plume management. Developed by an international team including Deltares, DEME, DHI, and USACE, the guidelines specify:
- Spill budgets: Quantitative limits on the sediment volume a dredging project may release to the environment — enforced through measurement, not estimation.
- Monitoring station layout: Systematic placement of fixed and mobile monitoring assets to capture plume extent, movement, and decay.
- Tiered response: Escalating operational responses triggered by measured exceedances — from increased monitoring frequency to dredger shutdown.
- Compliance documentation: Continuous records proving that plume concentrations remained within permit conditions at the mixing zone boundary.
Complementing WG 157, PIANC Report 214 (April 2023) frames dredged sediment as a resource — “beneficial use” — with a quantitative circularity tool for sediment management programs. Both documents establish a consistent expectation: modern dredging permits assume real-time plume measurement capability.
2.2 The Calibration Science: Backscatter to Concentration
ADCPs do not directly measure sediment concentration — they measure the acoustic energy scattered back from particles in the water column. Converting backscatter (in dB) to total suspended solids (TSS, in mg/L) requires calibration against physical water samples. Two calibration approaches are established in regulatory practice:
Empirical exponential calibration — Tauranga Harbour, New Zealand:
TSS = 0.0376 × exp(0.0622 × ADCP_dB)
Best-fit calibration, r² = 0.72 (n = 23 paired samples)
Sonar equation approach — Boston Harbor, USACE (Deines, 1999):
10log₁₀(SSC) = C_k + K_C·E + 10log₁₀(R²) + 2α_w·R
C_k = −19.208 mg/L, K_C = 0.3188 mg/L/dB (site-calibrated constants)
Both approaches require co-collected physical water samples analyzed gravimetrically (e.g., modified EPA Method 160.2). Optical backscatter sensors (OBS) are often deployed alongside ADCPs — OBS provides higher-accuracy point measurements that anchor the calibration curve, while the ADCP extends coverage across the entire water column and along the full survey track. For deeper background on the acoustic backscatter principle, see how ADCP backscatter measures suspended sediment.
2.3 Monitoring Configurations: Fixed Stations Plus Following Vessel
The operational gold standard — validated at the Port of Genoa, Italy — is a dual-system architecture:
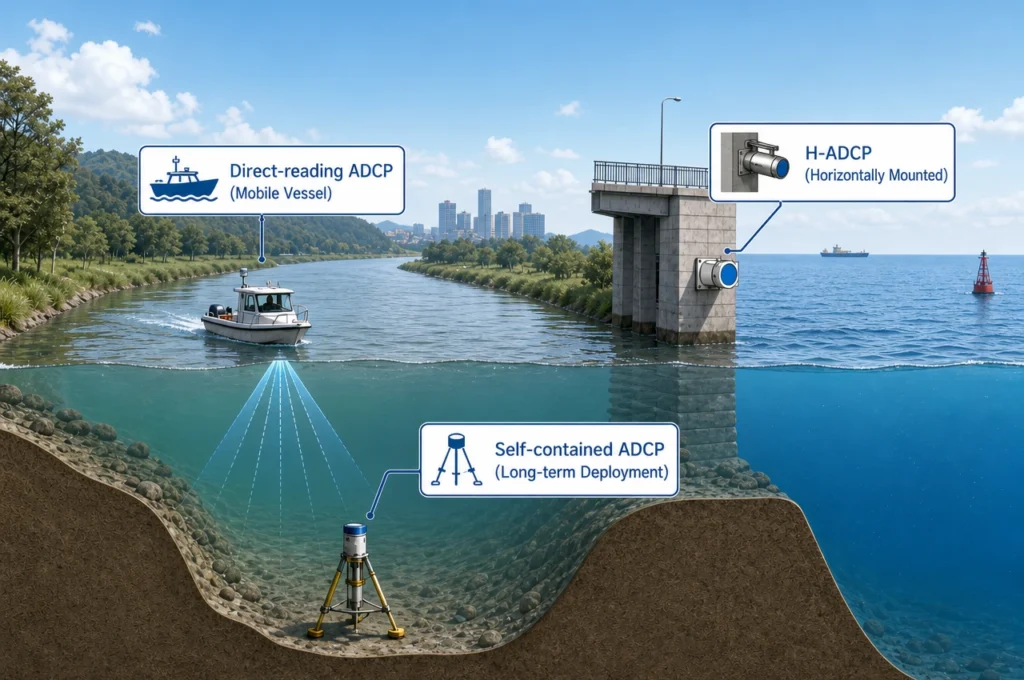
- Fixed monitoring stations at the port entrance and mixing-zone boundaries: each station carries a vertical ADCP plus a horizontal ADCP with CTD and turbidimeter, operating 24/7 to define baseline conditions and detect plume escape.
- A following survey vessel with a vessel-mounted vertical ADCP plus CTD/turbidimeter, positioned down-current of the dredger, running repeated transects to map plume evolution in real time.
The Genoa system tracked trailing suction hopper dredger (TSHD) plumes through the entire water column at 50 m from the dredger (with higher turbidity near the bottom), documenting much-reduced concentrations at 200 m. Backhoe-generated plumes showed lower turbidity and dissipated within 100 m. The system’s purpose was explicit: protect nearby Posidonia oceanica seagrass meadows by ensuring dredging plumes never escaped the port — and it succeeded by enabling operators to anticipate and stop outflow before it happened, rather than documenting damage after the fact.
2.4 Documented Plume Characteristics
USACE monitoring programs provide the definitive reference dataset for dredging plume behavior:
| Project | Dredger Type | Peak TSS | Decay Profile | Key Finding |
|---|---|---|---|---|
| Arthur Kill Waterway, NJ | Mechanical (environmental bucket) | ~300 mg/L at 10 m | ≤120 mg/L at 100 m; ≤50 mg/L at 150 m; 20 mg/L at 350 m | Detectable to 620 m, confined to channel basin; ambient <8 NTU, +15 NTU at 30 m |
| Port of Oakland, CA | Mechanical (closed bucket) | ~275 mg/L at source | Confined to lower water column; ambient recovery within 400 m | Weak tidal currents (<25 cm/s) limit dispersion; closed buckets prove effective |
| Boston Harbor, MA | TSHD + CAD operations | Varies by operation | Transects 300 ft up-current to 1500 ft down-current | Sonar-equation calibration; plume centroid tracking with CTD profiles |
| Port of Jebel Ali, UAE | Channel dredging | Real-time monitored | Transects along 200 m boundary lines | Radio-modem real-time data; coral reef protection; sediment flux quantified across permit limits |
The consistent finding across all programs: properly managed dredging plumes are localized phenomena. Concentration decays by an order of magnitude within the first 100–200 m, and modern bucket technologies (environmental and closed buckets) produce plumes that remain below regulatory thresholds at mixing-zone boundaries. But proving that — in real time, to a regulator — requires measurement, not modeling.
2.5 Compliance Documentation and Real-Time Decision Support
The Providence River project (USACE New England District, with Woods Hole Group) demonstrates the operational value of ADCP plume data beyond compliance paperwork. During dredging and confined aquatic disposal (CAD) operations, ADCP backscatter data detected plume levels in real time, supporting live decisions among the dredge contractor, USACE, and environmental regulators — including verifying that plumes and contaminants did not extend beyond approved mixing zones and providing the evidentiary basis for continuing, modifying, or halting operations.
For a deeper look at how the ADCP-600K supports channel maintenance dredging specifically, see our article on optimizing channel maintenance dredging with the Oceantek ADCP-600K.
3. Navigation Safety: Real-Time Currents for Pilots and VTS
A harbor pilot’s decision to berth a 200,000-tonne vessel depends on answers to questions that only real-time data can provide: What is the current doing right now at 20 meters depth? Is the predicted tide running early or late? Is there enough under-keel clearance for this draft on this tide?
3.1 NOAA PORTS®: The Proven Model
The NOAA Physical Oceanographic Real-Time System (PORTS®) is the world’s most extensive operational demonstration of real-time port monitoring value. The network spans more than half of the top 175 U.S. seaports — the Pearl Harbor–Honolulu system became the 40th PORTS installation — combining water-level gauges, meteorological stations, and buoy-mounted current meters into publicly accessible data feeds. The documented outcome: a 50% reduction in maritime accidents in ports with real-time data. The data integrates directly into vessel portable pilot units (PPUs) and port VTS displays, meaning the current measurement reaches the bridge in seconds, not hours.
3.2 Darwin Harbour: Currents That Move Mountains of Water
Darwin Harbour, Australia, illustrates the extreme end of the navigation-safety spectrum. With an 8-meter tidal range driving currents up to 2 m/s, the port handles Panamax and LNG carriers through a constrained entrance where sand waves restrict depth. The solution: an ADCP-based monitoring system (600 kHz with wave processing) installed on a navigation buoy, profiling currents at 20 m depth. Data on currents, tides, waves, and weather updates every 30 minutes and is viewable on pilots’ smartphones in near-real-time — enabling informed decisions on berthing windows that would otherwise be pure judgment calls.
3.3 Karachi Port Hydraulic Regime Study (2024)
The 2024 Karachi Port Hydraulic Regime Study demonstrates the planning-scale application: ADCP current surveys combined with multibeam bathymetry and numerical modeling to map siltation hotspots, wave agitation at berths, turning-basin optimization, and maneuverability envelopes for deeper-draft vessels. The study’s ADCP component was explicit about why: high-resolution vertical current profiles are essential for pilots steering large bulk carriers through narrow channels — knowing the exact velocity shear through the water column can be the difference between safe berthing and a costly grounding.
3.4 Under-Keel Clearance: The Economics of Real-Time Data
Beyond safety, real-time current and water-level data has direct commercial value through dynamic under-keel clearance (UKC) management. A vessel drawing 14 meters transiting a channel with 15.5 meters of charted depth at low water has only 1.5 meters of margin — until real-time data shows the actual tide is running 0.4 meters higher than predicted, plus 0.3 meters of squat reduction from a favorable current. That’s 0.7 meters of additional clearance: the difference between transiting now with 20,000 TEUs and waiting six hours for the next tide window. Ports with integrated real-time data systems (e.g., Port of San Diego’s ECDIS-integrated port management package, Port Freeport’s IPNEDS FlowInfo) convert this directly into vessel throughput capacity.
4. Siltation Monitoring: Predicting Where Sediment Will Go
Maintenance dredging — keeping existing channels navigable against continuous sedimentation — represents roughly half of the global dredging market. The key to reducing this perpetual cost is understanding where and why sediment accumulates, which requires current data.
4.1 The Mechanics of Harbor Siltation
Harbor siltation follows predictable physical mechanisms, all current-driven:
- Sand waves and bedload transport: Tidal currents push sediment along the channel bed; where currents weaken — at channel entrances, behind breakwaters, in turning basins — sediment drops out. At Darwin Harbour’s Marine Supply Base channel, 12 months of ADCP + multibeam surveys measured annual deposition of ~100 mm over the berth area and sandbar movement of 100–200 mm per month.
- Salt wedge dynamics: In estuarine ports, dense saline water intrudes beneath freshwater outflow. At the Port of Niigata (Shinano River mouth, Japan), field surveys combining current profiling, bathymetry, and fluid-mud density measurements revealed rapid siltation of a dredged channel — sedimentation up to ~2 m at channel slopes — driven by salt-wedge return flows beneath the pycnocline.
- Silt-dominated sudden siltation: On silt-dominated coasts, suspended sediment concentration responds explosively to flow changes. At Caofeidian, China, tripod-mounted ADCP/AWAC/OBS systems showed that strong flows triggered rapid SSC increases and heavy sudden siltation of navigation channels — a process invisible to periodic surveys.
4.2 Long-Term Monitoring: Hamburg Köhlfleethafen
The Port of Hamburg’s Köhlfleethafen basin study provides the template for integrated siltation assessment: long-term H-ADCP suspended sediment flux monitoring, calibrated with water samples and optical backscatter sensors, compared against multibeam echo sounder and sub-bottom profiler bathymetry. The synthesis determined the “nautical safe depth” for high-concentration suspensions — the depth below which the fluid-mud layer becomes a navigation hazard — and informed the choice between bed levelers and water injection dredgers for maintenance. The lesson: current data plus bathymetry equals siltation prediction; either alone is a snapshot.
4.3 Gopalpur Port: When Site Data Contradicts the Charts
At Gopalpur Port, India, bottom-mounted ADCP profiling revealed intense shear layers with peak velocities up to 0.9 m/s and directional shifts of ~40° within a single tidal cycle — a hydraulic regime that contradicted the assumptions embedded in existing dredging charts. The ADCP also documented salt-wedge dynamics and sediment plume interference. The operational conclusion was direct: dredging plans built on generic or outdated current data misallocate effort; site-specific ADCP measurement pays for itself in avoided mis-dredging.
4.4 From Fixed-Interval to Data-Driven Dredging
The synthesis of ADCP current data, continuous sediment flux monitoring, and periodic multibeam surveys transforms maintenance dredging economics:
| Approach | Dredge Trigger | Typical Outcome |
|---|---|---|
| Traditional fixed-interval | Calendar schedule (e.g., annual maintenance window) | Dredging whether needed or not; sudden siltation events caught late; channels either over-dredged (waste) or under-dredged (draft restrictions) |
| Data-driven (ADCP-informed) | Measured sediment flux + bathymetric trend + hydrodynamic forecast | Dredge when and where needed; siltation hotspots predicted before they become draft restrictions; dredge cycles extended where current regimes are favorable |
5. Equipment Selection for Port Monitoring
| Monitoring Objective | Deployment | Recommended Instrument | Key Specifications |
|---|---|---|---|
| Fixed cross-channel current monitoring | Bank/pier side-looking | HADCP-600 | 3-beam, 600 kHz, 90 m horizontal range, 2 Hz, RS-232/422 telemetry-ready |
| Regulatory bottom deployment (plume baseline) | Seabed frame | Ocean-ADCP-600-FA4 | 4-beam Janus, 600 kHz, 55–70 m profile, ≥100 days autonomy, 64 GB, ≤10 W |
| Deep channel / estuarine profiling | Seabed frame or buoy | Ocean-ADCP-300-FA4 | 300 kHz, 160 m profile, titanium to 6000 m |
| Point current on buoy / fixed structure | Buoy mid-water | OCEAN-SPCM | ±0.3% ±3 mm/s, 0.1 mm/s resolution, titanium, 504 Wh battery, PD0 |
| Dredge-following plume surveys | Survey vessel | River-ADCP-600-FA5 | 5-beam, 600 kHz, integrated GPS, 4 Hz max, ≤3.5 kg |
Three technical considerations are specific to the port environment and should drive configuration choices:
- Salinity stratification: Ports in estuarine environments develop sharp haloclines that refract acoustic beams. Select instruments with built-in temperature/salinity correction and verify sound-velocity settings against CTD profiles at the site. For guidance on matching frequency to site conditions, see the ADCP frequency selection guide.
- Turbidity attenuation: High suspended sediment loads attenuate the acoustic signal. In persistently turbid ports, a 300 kHz instrument provides penetration where 600 kHz range degrades. During active dredging operations, expect temporary range reduction in the plume zone — the fixed-station-plus-following-vessel architecture (Section 2.3) compensates for this.
- Vessel traffic interference: Shipping channels are acoustically noisy. Plan for rigorous data filtering, schedule baseline surveys in traffic windows where possible, and validate ADCP depth recordings against tide gauges as a continuous QC reference.
6. Implementation Roadmap: Five Steps to Port ADCP Integration
| Phase | Duration | Key Activities | Deliverable |
|---|---|---|---|
| 1. Baseline Assessment | 1–2 months | Deploy bottom-mounted ADCP at 1–3 strategic locations (channel entrance, turning basin, berth area); 30–60 day baseline current dataset; concurrent bathymetric survey | Baseline hydraulic regime report with siltation-risk map |
| 2. Fixed Network Deployment | 1–2 months | Install H-ADCP side-looking stations at channel control points; integrate with existing water-level gauges and VTS infrastructure; configure telemetry (cellular/satellite with radio backup) | Operational real-time current network feeding port systems |
| 3. Dredging Monitoring Integration | Per project | Deploy fixed stations at mixing-zone boundaries; outfit survey vessel with ADCP + OBS + CTD; calibrate backscatter with water samples (6–12 paired samples); establish spill-budget thresholds per PIANC WG 157 | Permit-compliant dredging monitoring capability |
| 4. Navigation Data Service | 1–2 months | Publish real-time current data to pilots (web/mobile/PPU integration); establish UKC calculation with water-level data; validate against pilot feedback | Pilot-facing real-time navigation service |
| 5. Annual Review and Optimization | Annual | Compare predicted vs. actual siltation; refine dredging schedule; update calibration curves; instrument maintenance and recalibration | Annual port monitoring report; optimized maintenance dredging plan |
7. Frequently Asked Questions
Q: How does ADCP monitor dredging silt plumes in ports?
ADCPs measure suspended sediment plumes by analyzing acoustic backscatter intensity, which correlates with suspended sediment concentration. Backscatter is calibrated against physical water samples using empirical exponential curves (e.g., Tauranga Harbour: TSS = 0.0376 × exp(0.0622 × dB), r² = 0.72) or the Deines (1999) sonar equation (Boston Harbor: C_k = −19.208, K_C = 0.3188). Two complementary configurations are standard: fixed ADCP stations at port entrances monitoring baseline conditions 24/7, plus a vessel-mounted ADCP following the dredger to map plume extent in real time — the dual approach validated at the Port of Genoa.
Q: How far do dredging plumes travel from the source?
USACE monitoring data shows rapid concentration decay: Arthur Kill Waterway measured ~300 mg/L at 10 m from the dredge, dropping to ≤120 mg/L at 100 m, ≤50 mg/L at 150 m, and 20 mg/L at 350 m — detectable to 620 m but confined to the channel. At the Port of Oakland, closed-bucket dredging produced ~275 mg/L peaks only adjacent to the source, with acoustic signatures distinct to 400 m. Actual extent depends on dredger type, sediment characteristics, and tidal currents — which is precisely why real-time measurement is required rather than assumption.
Q: What frequency ADCP is best for port and harbor monitoring?
The 600 kHz class is the workhorse for harbor depths (10–50 m), offering 55–90 m profiling range with high resolution. In highly turbid conditions, 300 kHz penetrates further (to 160 m) at reduced resolution. For fixed side-looking monitoring, the HADCP-600 covers 90 m horizontal range. Port-specific technical considerations include salinity stratification (requiring sound-velocity correction), turbidity attenuation, vessel traffic acoustic interference, and shifting seabeds affecting bottom-mounted stability.
Q: How does real-time current data improve port navigation safety?
Three measurable ways. First, it maximizes safe sailing windows and vessel draft — pilots accept berthing windows based on actual conditions, not predictions. Second, it prevents groundings: NOAA PORTS® documents a 50% reduction in maritime accidents in ports with real-time data. Third, it enables dynamic under-keel clearance management — real-time water level plus current data determines optimal transit windows for deep-draft vessels. At Darwin Harbour (8 m tidal range, 2 m/s currents), an ADCP on a navigation buoy updates pilots every 30 minutes for Panamax-class handling.
Q: How does ADCP data help optimize maintenance dredging schedules?
By quantifying the actual sediment transport regime, ADCP data transforms maintenance dredging from fixed-interval cost into data-driven decisions. Darwin Harbour’s Marine Supply Base channel measured ~100 mm/year deposition and 100–200 mm/month sandbar movement, enabling evaluation of channel realignment alternatives. Hamburg’s Köhlfleethafen combined long-term H-ADCP sediment flux with multibeam data to determine “nautical safe depth” and choose between bed levelers and water injection dredgers. Ports can then dredge where and when needed, not on calendar schedules.
Q: What are the PIANC guidelines for dredging environmental monitoring?
PIANC EnviCom WG 157 (October 2023) provides the current international best-practice framework: baseline establishment, indicator selection, monitoring station layout, adaptive management with tiered response, spill budgets, spill hindcast modeling, current/water-level forecasting, compliance monitoring, and post-project monitoring. Chapter 8 covers sediment spill control including silt curtains. PIANC Report 214 (April 2023) adds beneficial-use frameworks with circularity quantification. These are expert guidance — not obligatory standards — but regulators widely adopt them as reference for dredging permit conditions.
Q: What equipment does Oceantek offer for port and harbor monitoring?
Four configurations: the HADCP-600 (3-beam, 90 m horizontal, 2 Hz) for fixed cross-channel monitoring; the Ocean-ADCP-600-FA4 (55–70 m profile, ≥100 days autonomy) for bottom-mounted regulatory deployments; the Ocean-ADCP-300-FA4 (160 m profile) for deep channels and estuaries; and the OCEAN-SPCM single-point current meter (±0.3% ±3 mm/s, titanium, 504 Wh battery) for buoy-based point monitoring. All output industry-standard PD0 format and are manufactured under ISO 9001:2015 certified quality management.
8. Conclusion
Port water challenges are growing on every axis — bigger ships, relentless siltation, stricter environmental compliance — while port budgets and berthing windows stay tight. ADCP monitoring is the rare technology that converts all three pressures into a single integrated data capability: the same instrument class that tracks dredging plumes for regulators also feeds real-time currents to pilots and quantifies the sediment transport regime that drives maintenance dredging decisions.
The evidence base is mature. NOAA PORTS® has proven the navigation-safety value across 40 U.S. port systems. USACE plume monitoring programs have established the calibration science and documented plume behavior at regulatory standard. European ports from Genoa to Hamburg have demonstrated operational architectures for integrated dredging compliance. And the economics close decisively: for any port with a seven-figure maintenance dredging budget, the siltation-prediction and scheduling benefits alone justify the monitoring investment — before accounting for the accident reduction, throughput gains, and regulatory documentation value.
Oceantek’s port monitoring instruments — from the HADCP-600 for fixed channel monitoring to the Ocean-ADCP-600-FA4 for regulatory deployments — provide the measurement layer for this capability, manufactured under ISO 9001:2015 certified quality management and compatible with the industry’s standard PD0 data workflows.
Research Methodology: This article draws on 18+ primary sources including: PIANC EnviCom WG 157 (October 2023) and PIANC Report 214 (April 2023); NOAA PORTS® program documentation; USACE plume monitoring reports (Boston Harbor, Arthur Kill Waterway, Providence River); WEDA 2024 conference presentations (Port of Oakland); Darwin Harbour ADCP monitoring documentation (Marine Technology News, 2016); Karachi Port Hydraulic Regime Study (2024); Port of Genoa combined monitoring system (Springer, Journal of Soils and Sediments); Hamburg Köhlfleethafen suspended sediment monitoring; Gopalpur Port field deployment report; Tauranga Harbour calibration study (New Zealand); Port of Jebel Ali real-time monitoring (Chelsea Technologies); Port of Niigata salt-wedge siltation study; Caofeidian silt-dominated coast research (Taylor & Francis); global dredging market reports (2024–2025); and Oceantek product specifications for HADCP-600, Ocean-ADCP-600-FA4, Ocean-ADCP-300-FA4, OCEAN-SPCM, and River-ADCP-600-FA5.
Disclosure:Oceantek designs and manufactures acoustic Doppler current profilers and Doppler velocity logs at its ISO 9001:2015 certified facility in Hangzhou, China. The product recommendations in this article reflect Oceantek’s instrument portfolio, selected to illustrate the deployment configurations and selection principles applicable to port and harbor monitoring. References to Teledyne RDI, SonTek, and other manufacturers reflect actual instruments used in the cited studies and monitoring programs.
Last updated: August 17, 2026.