📊 Executive Summary
Global aquaculture crossed a historic threshold in 2024: 103 million tonnes of production worth $371 billion at farm gate (FAO SOFIA 2026). As the industry industrializes — cage diameters grew 27–87% between 2005 and 2020 — the margin between profit and loss increasingly depends on something invisible: water currents. Currents deliver oxygen to caged fish, flush away waste, shape cage structures, and determine whether a site can legally and ecologically support its stocking density.
Acoustic Doppler Current Profilers (ADCPs) are the only instrument class that measures currents across the full water column — and they are rapidly becoming a regulatory requirement for site approval in India, Vietnam, China, and certified sustainable aquaculture worldwide. This guide explains the science, the regulations, the deployment methodology, and the equipment selection framework that fish farm operators and aquaculture consultancies need to build defensible current monitoring programs.
📑 Table of Contents
1. Introduction: The Blind Spot in Fish Farming
Fish farmers can measure almost everything about their operation — feed conversion ratios, growth rates, water temperature, dissolved oxygen, mortality. Yet the single most important physical driver of farm performance remains invisible to most operators: the water currents flowing through the cage array.
The stakes have never been higher. FAO’s SOFIA 2026 report records global aquaculture production surpassing 100 million tonnes for the first time in history — 103 million tonnes of aquatic animals in 2024, valued at $371 billion — with projections of 119 million tonnes by 2034. This growth is not coming from more farms in the same old locations; it is coming from industrialization: bigger cages, denser stocking, and a deliberate shift toward exposed offshore sites with stronger currents (McIntosh et al., 2022). Between 2005 and 2020, satellite analysis of salmon farms worldwide showed cage diameters increasing 27–87% and total farm surface area growing by 61% in Chile, 84% in Scotland, and 221% in Norway.
Larger cages mean more fish per unit of water exchange. More fish mean more oxygen demand and more waste production. And stronger currents at exposed sites mean more structural load on cages and moorings. Every one of these pressures is a current problem — and every one is measurable with an ADCP.
2. Why Current Data Matters: The Science
Water currents are the circulatory system of a fish farm. They transport oxygen in, carry waste out, and exert mechanical forces on every structure in the water. Five scientific findings demonstrate why current monitoring is foundational to aquaculture management.
2.1 Oxygen Supply: The Lifeblood of the Cage
Fish respire. A cage holding 200,000 salmon extracts oxygen from the water flowing through it — and the rate of replenishment depends entirely on current velocity. Field measurements at an Atlantic salmon farm near Newfoundland quantified the effect: dissolved oxygen saturation inside cages fell to 64.8–78% at the downstream (northern) end, compared with over 85% at the upstream end and approximately 100% outside the farm (Environmental Hydraulics proceedings). Below 80% saturation, salmon show reduced appetite, slower growth, and poorer feed conversion — a direct economic loss per production cycle.
The mechanism is unambiguous: if incoming water at 100% oxygen saturation passes through a cage where fish consume oxygen, the outgoing water carries less. The faster the current, the faster the replenishment. A current of 0.3 m/s replaces the water in a 30 m cage in under 2 minutes; a current of 0.03 m/s takes nearly 20 minutes. Over hours of tidal stagnation, that difference is the margin between healthy fish and chronic sub-lethal stress.
2.2 Waste Dispersion: What Happens Under the Nets
Every fish farm produces particulate waste — uneaten feed and feces — that sinks toward the seabed. Whether that waste disperses or accumulates depends on the local flow field, and farm structures themselves dramatically alter that flow field.
Measurements at operational farms reveal a consistent picture: the cage array acts as a porous barrier, attenuating incident flow. CFD predictions indicate velocity reductions of approximately 50% behind the last cage in a multi-cage array. The attenuated water is partly deflected beneath the structures — field studies at commercial salmon farms measured a strong undercurrent at 20–35 m depth beneath the cages, extending to the seabed, with enhanced turbulence above it (Environmental Hydraulics proceedings). This flow reorganization has direct consequences: benthic impact from farm waste is typically confined to a radius of 40–70 m around the farm (Bayesian network review of 64 benthic monitoring studies), but that radius — and the severity of impact within it — is governed by local bathymetry and current regime.
For farms practicing Integrated Multi-Trophic Aquaculture (IMTA), where extractive species like seaweed and mussels are positioned downstream to capture farm nutrients, current data is not just useful — it is definitional. A towed-ADCP survey in the Bay of Fundy mapped near-field currents around Atlantic salmon cages through complete ebb and flood tidal cycles, producing depth-binned contour plots that directly guided the placement of extractive species for maximum nutrient capture (World Aquaculture Society, 2014).
2.3 Cage Deformation: Currents vs. Structures
Flexible net cages deform under current load. As flow speed increases, the net bag bulges and lifts, reducing effective cage volume precisely when the fish most need space — during high-flow events. Research by the Norwegian University of Science and Technology (NTNU, 2024) at an operational farm combined an ADCP measuring incoming currents with acoustic Doppler velocimeters (ADVs) measuring in-cage velocity and high-resolution pressure tags tracking cage lift. The key findings:
- Cage lift correlates strongly with incoming current speed — faster currents produce more lift and more net deformation.
- Flow inside the cage shows a weaker link to upstream flow than expected, because the net itself damps and redirects current — a flow reduction factor of r = 0.8 produced the most accurate deformation predictions.
- Numerical models (Orcaflex) fed with ADCP-measured incident currents predicted cage depth deformation with deviations typically under 15% — a practical accuracy for engineering decisions on cage design, mooring loads, and fish-welfare risk thresholds.
The operational implication: ADCP current data is the input that turns a cage from a passively vulnerable structure into a predicted, managed system — operators know before a storm event which cages will deform, by how much, and when action is needed.
2.4 Site Selection: The D·V² Index
Why do some fish farm sites stay healthy for decades while others accumulate toxic sediment within a few production cycles? The quantitative answer was provided by Yokoyama et al. (2004) in the form of the Index of Suitable Location (ISL):
ISL = D × V²
D = water depth (m) | V = mean current velocity (m/s)
Field validation at eight Japanese net-pen farms confirmed the index’s predictive power: as ISL decreased and fish production increased, bottom-water dissolved oxygen declined while sediment TOC, TN, TP, COD, and acid-volatile sulfide accumulated, and macrobenthos biomass and diversity collapsed. The index allowed classification of farm environments into healthy, cautionary, and critical zones — providing regulators and operators a single quantitative criterion for siting decisions. The recommendation is direct: avoid sites with low water movement.
ISL requires accurate current velocity data at candidate sites — precisely the measurement ADCPs are designed to provide. A pre-deployment site survey measuring V across the full water column, combined with bathymetric depth D, yields the ISL value that predicts whether a site can sustain its intended production level.
2.5 Fish Welfare: Behavior Follows Flow
Fish are not passive occupants of their cages. Combining ADCP current measurements with echosounders, dissolved oxygen sensors, and temperature loggers, SINTEF researchers demonstrated that Atlantic salmon actively avoid waves by swimming below them, and that fish distribution within cages is systematically related to wave and current exposure (Klebert et al., 2023). An integrated numerical model reproduced the observed fish distributions when fed with measured flow data.
This has direct welfare and production implications. In a study at the SINTEF facility at Tristelmen, Norway, a moored buoy equipped with an ADCP (1 Hz sampling, 10-minute ensembles, 3 m depth cells) provided the continuous current profile that explained spatial patterns of fish distribution. When fish crowd into a reduced cage volume during high-current events, oxygen competition intensifies and aggression increases — and the trigger is measurable in the current data hours before behavioral stress becomes visible to surface observation.
3. Regulatory Drivers: Compliance Is Becoming Mandatory
Current monitoring is moving from best practice to legal requirement. Five regulatory developments between 2024 and 2025 demonstrate the trend:
3.1 India — Coastal Aquaculture Authority Rules 2024
India’s new cage and pen culture guidelines, issued under the Coastal Aquaculture Authority Act, specify explicit environmental criteria for site approval: water current of 0.30–1.0 m/s, water depth greater than 5 m at low tide, dissolved oxygen 5–7 mg/L, and salinity 15–35 ppt. Sites must be identified based on oceanographic and carrying-capacity studies, with geo-coordinates and geo-fencing required for registration. Current measurement is no longer optional for Indian cage aquaculture — it is a registration prerequisite.
3.2 Vietnam — Provincial Marine Aquaculture Standards (2025)
Khanh Hoa Province’s September 2025 regulations — prompted by unregulated growth exceeding 100,000 cages in Cam Ranh Bay — require cage structures to withstand currents of 0.5–1 m/s along with winds of level 6–7 (38–61 km/h) and waves of 2–4 m. The regulations mandate HDPE/FRP cage materials, surveillance cameras on cages, and a phased conversion roadmap (100% compliance by 2028–2029). Quang Ninh Province, meanwhile, has conducted over 30,000 environmental samples in four years and is issuing its own technical standards.
3.3 China — GB/T 43744-2024 National Standard
China’s national standard GB/T 43744-2024, “General technical requirements for aquaculture environmental monitoring system,” published March 2024 and implemented October 1, 2024, establishes system composition and technical requirements for the perception, transmission, and application layers of environmental monitoring systems. It applies explicitly to cage (net-pen) farming monitoring system design, construction, and use — creating a national compliance framework in the world’s largest aquaculture producer (81.6% of China’s aquatic production comes from aquaculture).
3.4 ASC Farm Standard v0.4 (2024) — Global Certification
The Aquaculture Stewardship Council’s revised Farm Standard requires farms to classify receiving waters by nutrient-loading sensitivity (Type A: sensitive lakes/fjords/lagoons; Type B: sensitive lotic systems; Type C: well-flushed systems). Farms in sensitive waterbodies must join Area Management Agreements (AMAs) with coordinated environmental monitoring, carrying-capacity assessments, and 12–24 months of rolling baseline data — including current measurements. For salmon farmers selling into European and North American markets where ASC certification is a market-access requirement, current monitoring data is now a certification prerequisite.
3.5 SEPA (Scotland) — Site Approval Practice
Scotland’s environmental regulator requires hydrographic reports as supporting documentation for marine fish farm permit applications. Review of SEPA site-approval documents (e.g., Billy Baa, North Gravir) reveals a consistent technical standard: at least 90 days of current data (typically 90–112 days across two seasonal deployments), collected with ADCPs on gimballed seabed frames, with post-recovery quality checks on heading/pitch/roll, magnetic declination correction, and validation against bathymetric charts.
| Jurisdiction / Scheme | Year | Current-Related Requirement |
|---|---|---|
| India CAA Rules | 2024 | Current 0.30–1.0 m/s; depth >5 m; DO 5–7 mg/L — registration prerequisite |
| Vietnam Khanh Hoa | 2025 | Structures withstand 0.5–1 m/s currents; mandatory surveillance |
| China GB/T 43744-2024 | 2024 | Environmental monitoring system standard for cage farming |
| ASC Farm Standard v0.4 | 2024 | 12–24 months baseline data in sensitive waterbodies |
| SEPA (Scotland) | Ongoing | 90+ days ADCP current data for site approval |
4. How to Measure: ADCP Deployment for Aquaculture
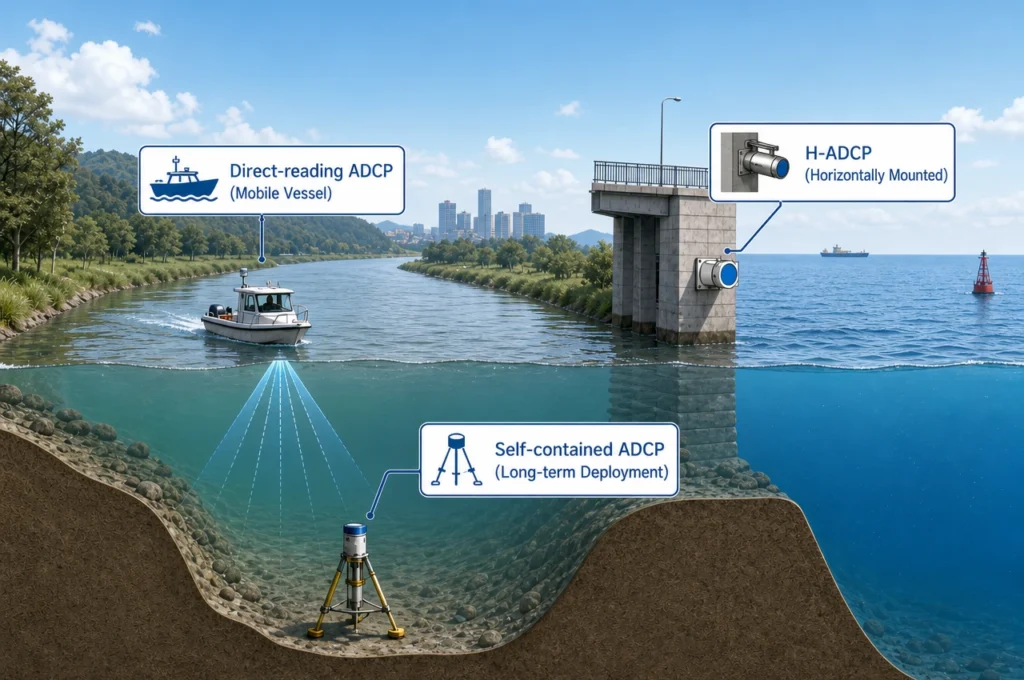
Three deployment configurations cover the full range of aquaculture current monitoring needs, each with established field methodology.
4.1 Seabed Frame Deployment — the Regulatory Standard
The bottom-mounted ADCP in a gimballed frame is the workhorse configuration for site surveys and regulatory compliance. The deployment standard, documented in SEPA hydrographic reports, follows this sequence:
- Pre-deployment sounding: Measure site depth at high tide to configure the ADCP’s profiling range and cell structure for the expected tidal range.
- Frame design: The mooring frame allows 20° of free gimbal movement so the instrument self-levels on the seabed; the transducer head sits approximately 60 cm above the frame base to avoid interference from resuspended sediment.
- Instrument configuration: Select cell size (typically 1–4 m for farm depths of 20–80 m) and sampling strategy. A 500 kHz–600 kHz class ADCP covers farm water depths to 70–80 m; for deeper sites, a 300 kHz instrument profiles to 160 m. For guidance on matching frequency to depth, see our ADCP frequency selection guide.
- Deployment duration: Minimum 90 days, ideally across two seasons (e.g., late summer + autumn) to capture seasonal circulation changes.
- Recovery and QC: Post-recovery, verify heading/pitch/roll stayed within the manufacturer’s 20° tilt limit, check signal strength for obstructions (creels, mooring lines), apply magnetic declination correction (declination minus grid convergence), and validate depth recordings against bathymetric charts.
4.2 Buoy-Integrated Deployment — Real-Time Farm Monitoring
For operational farms, the moored buoy configuration provides continuous real-time data. The SINTEF Tristelmen research facility configuration is representative: an ADCP on a moored buoy sampling at 1 Hz with 10-minute ensembles and 3 m depth cells, co-located with wave, temperature, and salinity sensors. Data streams support three operational functions: farm operations management (deciding when conditions allow feed barges and workboats to operate safely), welfare monitoring (detecting high-current events before fish show visible stress), and compliance documentation (continuous records for audit).
The OCEAN-SPCM single-point current meter offers a cost-effective complement to full-profile ADCPs for buoy deployments: ±0.3% ±3 mm/s accuracy, 0.1 mm/s velocity resolution, titanium housing rated to 1000/3000/6000 m, and in self-contained configuration a 504 Wh lithium battery supporting months of unattended operation — ideal for mid-water current measurements at cage depth without the cost of a full profiling system.
4.3 Vessel-Mounted Surveys — Spatial Wake Mapping
When the question is spatial — how does the flow field vary around and between cages — the vessel-mounted ADCP provides the answer. At a full-scale salmon farm in Tórshavn, Faroe Islands, researchers conducted boat-mounted ADCP transects over two days of oscillating tidal currents, then applied kriging interpolation to build a 3D volume of the flow field including bathymetry. The measured velocity reduction from cage nets agreed with theoretical predictions within 5% (Klebert et al.). The Bay of Fundy IMTA study similarly used a towed ADCP through ebb and flood tides with 1 m depth bins to generate contour plots at multiple depths — data that directly determined where mussels and kelp should be positioned downstream to capture nutrients.
For these mobile surveys, the River-ADCP-600-FA5 (5-beam, 600 kHz, integrated GPS, ≤3.5 kg) or the Ocean-ADCP-600-FA4 in direct-reading configuration provide the profiling performance required for farm-scale spatial surveys in coastal depths.
4.4 Data Quality Assurance
Aquaculture regulatory data must survive scrutiny. The SEPA-documented QA workflow provides a template:
- Download raw data in instrument-native software and run integrity checks on heading, pitch, roll, depth, and anomalous velocity spikes.
- Extract raw data to ASCII for sensor-level inspection and cross-validation in independent tools.
- Validate ADCP depth recordings against bathymetric charts (e.g., UKHO data).
- Apply magnetic declination and grid convergence corrections post-recovery.
- Report summary statistics at the depths that matter: sub-surface, cage-bottom, and near-bed bins.
5. Equipment Selection Matrix
| Monitoring Objective | Deployment | Recommended Instrument | Key Specifications |
|---|---|---|---|
| Regulatory site survey (90+ days) | Seabed gimballed frame | Ocean-ADCP-600-FA4 (self-contained) | 600 kHz, 4-beam Janus, 55–70 m profile, ≥100 days autonomy, 64 GB storage, ≤10 W |
| Deep-water site survey (>80 m) | Seabed gimballed frame | Ocean-ADCP-300-FA4 | 300 kHz, 160 m profile, titanium housing to 6000 m |
| Point current at cage depth (buoy) | Moored buoy mid-water | OCEAN-SPCM | ±0.3% ±3 mm/s, 0.1 mm/s resolution, titanium, 504 Wh battery, PD0 output, 1 Hz |
| Fixed real-time farm monitoring | Bank/frame side-looking | HADCP-600 | 3-beam, 90 m horizontal range, 2 Hz, RS-232/422 telemetry-ready |
| Spatial wake mapping (IMTA layout) | Vessel-mounted / towed | River-ADCP-600-FA5 | 5-beam, 600 kHz, integrated GPS, ≤3.5 kg, 4 Hz max sampling |
All Oceantek instruments are manufactured under ISO 9001:2015 certified quality management and output industry-standard PD0 format compatible with WinRiver II and QRev — ensuring aquaculture survey data integrates with the processing workflows already used by environmental consultancies and regulatory reviewers.
6. Implementation Roadmap: From Site Search to Certified Operation
| Phase | Duration | Key Activities | Deliverable |
|---|---|---|---|
| 1. Site Pre-Assessment | 1–2 months | Desktop review of bathymetric charts and historical data; short-listing candidate sites; preliminary ISL (D·V²) estimation from available current data | Ranked shortlist of candidate sites |
| 2. Baseline Current Survey | 90–120 days | ADCP deployment on gimballed seabed frame at each candidate site; two seasonal deployments; concurrent water quality sampling (DO, temperature, turbidity) | Regulatory-grade current dataset with full QC documentation |
| 3. Analysis and ISL Calculation | 2–4 weeks | Data processing (declination correction, validation); computation of depth-binned summary statistics; D·V² index calculation; comparison against regulatory thresholds (e.g., India 0.30–1.0 m/s) | Site suitability report with ISL classification |
| 4. Compliance Documentation | 2–4 weeks | Preparation of hydrographic report following jurisdictional format (e.g., SEPA supporting documentation); submission with permit application | Permit submission package |
| 5. Operational Monitoring | Continuous | Permanent instrumentation (buoy ADCP or SPCM + telemetry) for real-time farm operations; threshold alerts for high-current events | Live operations dashboard + continuous compliance record |
| 6. Certification Maintenance | Annual | ASC/GAqP audit data maintenance; annual report compilation; calibration verification; instrumentation service | Certification-ready annual monitoring package |
7. Frequently Asked Questions
Q: Why do fish farms need current monitoring?
Current velocity controls four critical factors: oxygen supply (field measurements show dissolved oxygen inside cages at 64.8–78% saturation vs >85% outside), waste dispersion (cage nets reduce downstream velocity by ~50%, and the undercurrent beneath cages determines benthic impact radius), cage deformation (currents deform flexible nets with a flow reduction factor of r = 0.8 for accurate prediction), and site assimilative capacity (the D·V² index quantifies whether a site can absorb farm waste). Without current data, farms cannot optimize site selection, stocking density, or regulatory compliance.
Q: What current velocity is required for fish cage farming?
India’s Coastal Aquaculture Authority Rules (2024) specify currents of 0.30–1.0 m/s with depth >5 m at low tide. Vietnam’s Khanh Hoa regulations (2025) require structures to withstand 0.5–1 m/s. As a design guideline: 0.1–1.0 m/s supports adequate oxygen exchange and waste flushing; below 0.05 m/s risks oxygen depletion and benthic impact; above 1.0 m/s increases cage deformation, mooring loads, and fish stress.
Q: How does ADCP measure currents at fish farms?
ADCPs transmit acoustic pulses that reflect off particles in the water column; the Doppler frequency shift of the echo yields velocity at multiple depth cells simultaneously. Three configurations serve aquaculture: bottom-mounted in gimballed frames (regulatory standard, 20° self-leveling), buoy-integrated for real-time monitoring (1 Hz sampling, 10-minute ensembles), and vessel-mounted for spatial wake mapping with kriging-based 3D flow reconstruction. All Oceantek instruments output PD0 format compatible with WinRiver II and QRev.
Q: How long should current monitoring last for aquaculture site approval?
Regulatory best practice requires at least 90 days of current data, typically via two seasonal deployments. SEPA documents 90–112 day deployments; the ASC Farm Standard requires 12–24 months of rolling baseline data for sensitive waterbodies. Coverage should include a complete spring-neap tidal cycle and ideally summer and winter conditions.
Q: What is the D·V² site selection index for aquaculture?
The Index of Suitable Location (ISL = D·V², where D is depth and V is mean current velocity) was proposed by Yokoyama et al. (2004) and validated at eight Japanese net-pen farms. Higher ISL values indicate healthier sites with greater assimilative capacity; low ISL with high production correlates with depleted bottom oxygen, accumulated sediment sulfides, and collapsed benthic communities. ISL provides a single quantitative criterion for siting decisions — and requires accurate ADCP current measurements to compute.
Q: What equipment does Oceantek offer for aquaculture current monitoring?
Three instrument classes cover aquaculture needs: the Ocean-ADCP-600-FA4 (600 kHz, 55–70 m profile, ≥100 days self-contained autonomy) for regulatory seabed-frame surveys; the OCEAN-SPCM single-point current meter (±0.3% ±3 mm/s, titanium housing, 504 Wh battery, PD0 output) for cost-effective buoy-based point measurements at cage depth; and the HADCP-600 (90 m horizontal range, 2 Hz) for fixed real-time farm monitoring. All are manufactured under ISO 9001:2015 certified quality management in Hangzhou, China.
Q: Why is low-frequency water sampling insufficient for fish farm monitoring?
A 2024 FAO AGRIS study compared high-frequency monitoring (10-minute intervals via autonomous ADCP-based platforms) against monthly sampling at fish production sites. High-frequency data captured the true daily amplitude of variation in temperature, pH, dissolved oxygen, turbidity, and chlorophyll-a; low-frequency sampling failed to demonstrate natural variability and was deemed ineffective for environmental monitoring of fish production. Continuous ADCP-based monitoring is becoming the accepted standard for both regulatory compliance and operational decision-making.
8. Conclusion
Aquaculture’s industrialization — 103 million tonnes and $371 billion in 2024, heading toward 119 million tonnes by 2034 — has made water current data an operational necessity rather than a research curiosity. The science is settled: currents control oxygen delivery, waste dispersion, cage integrity, and site longevity. The regulations are arriving: India’s 0.30–1.0 m/s current requirement, Vietnam’s structural standards, China’s GB/T 43744-2024, and ASC’s baseline-data mandates all require measured current data for compliance. And the technology is mature: ADCPs deliver full water-column current profiles from seabed frames, buoys, or vessels with the accuracy and autonomy that regulatory reviewers expect.
Whether you are a farm operator planning a new site, a consultancy preparing a SEPA-style hydrographic report, or an IMTA developer optimizing extractive species placement, the path is the same: measure currents early, measure them continuously, and build the multi-year datasets that both compliance and good farming demand. Oceantek’s aquaculture monitoring instruments — from the Ocean-ADCP-600-FA4 for seabed surveys to the OCEAN-SPCM for buoy deployments — provide the measurement layer for that foundation, manufactured under ISO 9001:2015 certified quality management and compatible with the industry’s standard data workflows.
Explore Oceantek’s ADCP solutions for fisheries and aquaculture to see the full application picture.
Research Methodology: This article draws on 18+ primary sources including: FAO State of World Fisheries and Aquaculture (SOFIA 2026); SINTEF/Klebert et al. (2023) cage flow and fish behavior studies; ScienceDirect wake visualization and benthic impact research; McIntosh et al. (2022, Aquaculture) global cage technology analysis; Yokoyama et al. (2004) D·V² site selection index; NTNU 2024 cage deformation research (via AquaHoy); India Coastal Aquaculture Authority Rules 2024; Vietnam Khanh Hoa cage farming regulations 2025; China GB/T 43744-2024 national standard; ASC Farm Standard v0.4 (2024); SEPA hydrographic reports (Billy Baa, North Gravir); World Aquaculture Society IMTA current measurement abstract; FAO AGRIS high-frequency monitoring study (2024); Newfoundland dissolved oxygen field study; and Oceantek product specifications for Ocean-ADCP-600-FA4, Ocean-ADCP-300-FA4, OCEAN-SPCM, HADCP-600, and River-ADCP-600-FA5.
Disclosure: Oceantek designs and manufactures acoustic Doppler current profilers and Doppler velocity logs at its ISO 9001:2015 certified facility in Hangzhou, China. The product recommendations in this article reflect Oceantek’s instrument portfolio, selected to illustrate the deployment configurations and selection principles applicable to aquaculture current monitoring. References to Teledyne RDI, SonTek, and other manufacturers reflect actual instruments used in the cited studies.
Last updated: August 13, 2026.