📊 Executive Summary
Dams and reservoirs are essential infrastructure — but they are quietly losing capacity. Global reservoirs lose an average of 0.8% of their storage capacity every year to sedimentation (ICOLD, 2024). For a reservoir designed to operate for 50 years, that means nearly 40% of its original storage may be gone by mid-life — unless sedimentation is actively measured and managed.
Acoustic Doppler Current Profilers (ADCPs) have emerged as the only instrument class capable of addressing three core dam monitoring objectives simultaneously: discharge measurement at spillways and outlets, suspended sediment concentration (SSC) from acoustic backscatter, and reservoir bathymetry for capacity assessment. This guide covers the methods, equipment, and regulatory framework dam operators need to build or upgrade their ADCP monitoring programs.
📑 Table of Contents
- Introduction: Why Dam Operators Are Turning to ADCP Technology
- Reservoir Sedimentation: The Scale of the Problem
- ADCP Monitoring Methods for Dam Reservoirs
- Equipment Selection: Which ADCP for Your Dam?
- Regulatory Compliance: What Dam Operators Need to Know
- Case Studies
- Implementation Roadmap
- Frequently Asked Questions
- Conclusion
1. Introduction: Why Dam Operators Are Turning to ADCP Technology
Traditional reservoir monitoring relies on three separate workflows: mechanical current meters or cable-suspended point samplers for discharge, manual bottle sampling for suspended sediment, and periodic echo-sounder surveys for bathymetry. Each requires dedicated vessels, trained crews, and — critically — calm weather. None captures flood events, when the majority of annual sediment transport occurs.
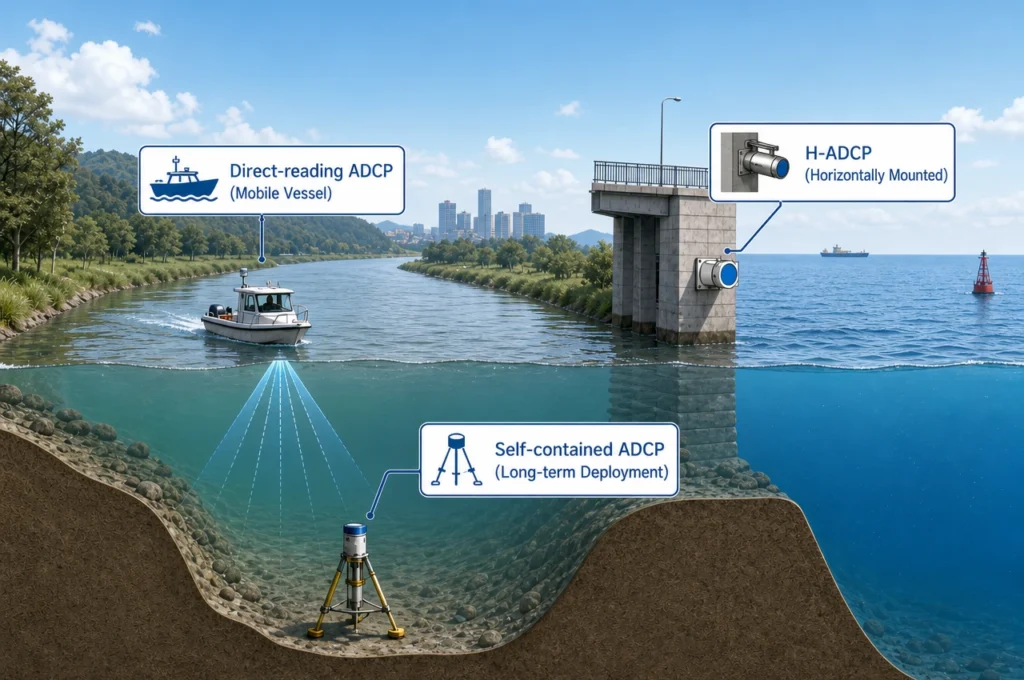
ADCPs change this equation. A single instrument mounted on a moving boat, fixed on the reservoir bottom, or installed on a bank-mounted frame can simultaneously record:
- Flow velocity profiles at user-defined depth cells across the full water column, from which total discharge is computed using the velocity-area method defined in ISO 24578:2021 and USGS Techniques and Methods 3-A8.
- Acoustic backscatter intensity that correlates with suspended sediment concentration (SSC) after site-specific calibration against physical water samples, enabling continuous sediment flux monitoring without the cost and delay of laboratory analysis.
- Bottom depth via dedicated vertical echo-sounder beams on multi-beam instruments, providing simultaneous bathymetry during moving-boat discharge surveys.
2. Reservoir Sedimentation: The Scale of the Problem
Reservoir sedimentation is not a future problem — it is happening now, and the numbers are sobering. The International Commission on Large Dams (ICOLD), using its global Register on Dams, found that the mean annual reservoir sedimentation rate is 0.8% of original storage capacity worldwide (ICOLD, 2024). This translates to approximately 45–55 billion cubic meters of storage lost each year across the global reservoir fleet.
The Three Gorges Reservoir on the Yangtze River provides the most comprehensively documented case. Between June 2003 and November 2017, the Changjiang Water Resources Commission (CWRC) measured a net deposition of 1.48 billion m³ using repeat cross-section surveys. However, this was only approximately 40% of the sedimentation projected during the project's design phase, because upstream sediment supply declined dramatically: annual sediment load at the inflow station fell from approximately 490 million tonnes (1956–1990 average) to roughly 34 million tonnes by 2017. Within the critical flood-control zone (elevation 145 m to 175 m), deposited sediment occupied just 0.125 billion m³ — a flood storage capacity loss of only 0.56% after 14 years of operation.
Not all reservoirs are so fortunate. At the Ouled Mellouk reservoir in Algeria, satellite remote sensing analysis (Landsat-8 and Sentinel-2 optical imagery fused with Sentinel-1 SAR data) found that 8.57 hm³ of sediment accumulated over 15 years, resulting in approximately 7 hm³ of permanent storage capacity loss (Tandfonline, 2026).
| Reservoir | Period | Sediment Deposited | Capacity Loss | Data Source |
|---|---|---|---|---|
| Three Gorges (China) | 2003–2017 | 1.48 bn m³ | Flood storage: 0.56% | CWRC |
| Ouled Mellouk (Algeria) | ~2009–2024 | 8.57 hm³ | ~7 hm³ permanent | Satellite remote sensing (2026) |
| Global mean (ICOLD) | Annual | — | 0.8% of original capacity per year | ICOLD Register on Dams (2024) |
Sedimentation undermines dam functions on three fronts simultaneously. Flood control capacity erodes as sediment fills the flood pool, reducing the volume available to absorb peak inflows. Hydropower generation efficiency declines when sediment accumulates near intakes — at the Chambon dam in the French Alps, EDF (Électricité de France) had to conduct a dilution-pumping dredge specifically because accumulated sediment threatened to block the bottom outlet gate, the reservoir's primary safety device (Hauet et al., EGU 2022). And downstream river morphology shifts as sediment-starved releases erode channels and undermine bridge piers and embankments — a phenomenon documented in ICOLD Bulletin 147.
3. ADCP Monitoring Methods for Dam Reservoirs
ADCPs serve three distinct monitoring functions in dam reservoirs, each with its own standard methodology, accuracy envelope, and operational constraints. Understanding which method addresses which monitoring objective is the first step in designing an effective program.
3.1 Moving-Boat Discharge Measurement at Spillways, Outlets, and Inflows
The moving-boat ADCP method — codified in ISO 24578:2021 (Hydrometry — Acoustic Doppler profiler — Method and application for measurement of flow in open channels from a moving boat) and USGS Techniques and Methods 3-A8 — is now the standard approach for discharge measurement at dam sites. The vessel traverses the cross-section while the ADCP measures water velocity in depth cells along each of four (or more) acoustic beams in a Janus configuration, with bottom tracking or GNSS determining boat velocity.
The USGS-recommended field procedure for dam-site discharge measurement follows a structured workflow:
- Pre-deployment checks: Beam alignment verification, compass calibration (two smooth 360° rotations over 60–120 seconds — acceptable error <0.5°, magnetic error <3.5°), GPS synchronization, and sound speed correction based on measured temperature and salinity profiles.
- Site selection: Choose a cross-section with uniform flow, minimal turbulence, and adequate depth for the ADCP frequency. Downstream of spillways, position the survey reach beyond the hydraulic jump zone where flow returns to subcritical conditions.
- Moving-bed test: Before each survey session, conduct a stationary test (≥5 minutes with bottom-tracking enabled) to check for apparent boat motion from sediment transport on the reservoir bed — a common condition in reservoirs with active delta advancement. If moving-bed conditions are detected, switch to GPS-referenced boat velocity or apply a loop correction.
- Transect collection: Complete a minimum of four transects (two in each direction) at a boat speed not exceeding the mean flow velocity. Maintain a consistent heading perpendicular to the cross-section. In flood conditions where boat path becomes irregular, the DMG (Distance Made Good) heading correction method reduces discharge errors from >10% to 1.2–3.7% of rating-table values (Lee, 2016).
- Post-processing: Review data quality indicators — percent good pings (>85% for broadband, >90% for narrowband), error velocity, and signal-to-noise ratio — before computing the mean discharge from all valid transects. The USGS QRev software provides automated quality assurance and discharge computation from ADCP raw data in PD0 format.
3.2 Suspended Sediment Monitoring via Acoustic Backscatter
ADCP acoustic backscatter provides a continuous proxy for suspended sediment concentration (SSC) that, once calibrated, transforms reservoir sediment monitoring from episodic grab-sampling to real-time flux measurement. The physical principle is straightforward: the intensity of the acoustic signal scattered back from particles in the water column is proportional to the concentration and size of those particles. In practice, converting backscatter to SSC requires careful calibration.
The calibration workflow follows four steps:
- Collect ADCP backscatter data (in counts or dB) along with simultaneous physical water samples at the same depths and times. A point-integrating or pump sampler deployed at the ADCP measurement location captures the same water volume the acoustic beams are interrogating.
- Measure SSC gravimetrically in the laboratory for each physical sample, and optionally measure particle size distribution by laser diffraction or sieving.
- Regress ADCP backscatter against measured SSC using the sonar equation to correct for transmission losses (spreading and absorption along the acoustic path). The standard form is a power-law or log-linear relationship. Including the suspended sediment absorption coefficient — which varies with particle size — significantly improves accuracy: studies at the Yangtze-Poyang Lake confluence during Three Gorges regulation periods found that methods neglecting this coefficient systematically underestimated SSC, whereas incorporating it successfully retrieved concentrations (Springer, 2024).
- Re-calibrate periodically — annually at minimum, and after major floods that may change sediment source and particle size characteristics.
Three published case studies demonstrate the method's operational maturity:
| Dam / Site | Country | Operator | ADCP Configuration | Monitoring Objective |
|---|---|---|---|---|
| Chambon Dam | France | EDF | TRDI RioGrande 600 kHz, tilted 20° (Beam 1 to nadir) | Verify dredging efficiency — mapped no-, low-, and high-concentration sediment plume zones; confirmed fine sediment entrainment toward power-plant intake |
| Banja HPP (Devoll River) | Albania | Statkraft | Two side-looking ADCPs (600 + 1200 kHz), fixed station with automated data transmission | Continuous SSC + discharge during floods; analytical attenuation-backscatter ratio method for SSC; GUI for echo profile interpretation |
| Geum Estuarine Dam | Korea | — | ADCP + physical water sample calibration | Sediment flux decomposition: mean-flow (seaward) component controlled by dam discharge; tidal correlation (landward) component enhanced by dam-amplified tides, leading to siltation |
Key limitation: Under very high sediment loads (>10–20 g/L), acoustic signal attenuation becomes severe and the relationship between backscatter and SSC may become non-monotonic — the instrument effectively goes blind. For reservoirs experiencing hyper-concentrated flows (e.g., during drawdown flushing operations), acoustic methods should be supplemented with optical backscatter sensors or physical sampling at the highest concentrations.
3.3 Bathymetric Surveys for Reservoir Capacity Assessment
Repeat bathymetric surveys are the definitive method for quantifying reservoir storage capacity loss. The USACE Engineer Manual EM 1110-2-4000 (February 2025) provides the most current survey methodology guidance for dam operators, describing four primary techniques:
| Method | Coverage | Resolution | Relative Cost | Best For |
|---|---|---|---|---|
| Single-beam echo sounder | Line profiles | 0.1–0.3 m vertical | $ | Small reservoirs, sediment range lines, annual trending |
| Multibeam echo sounder | Full swath coverage | 0.05–0.15 m vertical, <1 m horizontal | $$$ | Large reservoirs, structure inspection, regulatory-grade surveys |
| Sub-bottom profiler (SBP) | Line profiles | Sediment layer thickness to cm-scale | $$ | Pre-dam surface mapping, historical accumulation, sites without baseline bathymetry |
| Satellite remote sensing | Full water surface | 0.5–2.0 m vertical (depends on drawdown range and image stack density) | $ | Remote/inaccessible reservoirs, regional screening, between-survey trending |
USACE EM 1110-2-4000 specifically recommends sediment range lines — fixed cross-sections surveyed repeatedly over time — as the lowest-cost method for monitoring delta advancement into the reservoir pool and tracking bank erosion rates over decades. For large reservoirs such as the Missouri River mainstem projects (200–400 square miles), these partial surveys using selected key locations may be the only economically feasible approach between full-pool multibeam surveys.
4. Equipment Selection: Which ADCP for Your Dam?
Selecting the right ADCP for dam monitoring is primarily a function of reservoir depth — which dictates the acoustic frequency — and deployment scenario — which determines the transducer configuration, beam count, and mounting solution.
4.1 Frequency Selection by Reservoir Depth
| Frequency | Max Profiling Range | Suitable Reservoir Type | Oceantek Models |
|---|---|---|---|
| 75 kHz phased-array | 650 m | Large deep reservoirs (Three Gorges class), deep pre-dam current profiling | Ocean-ADCP-75-PA4 |
| 300 kHz piston | 160 m | Medium-to-large reservoirs, cascade hydropower stations, mid-depth profiling | Ocean-ADCP-300-FA4 |
| 600 kHz series (4 models) | 55–90 m | Small-to-medium reservoirs, pre-dam zones, inflow channels, horizontal monitoring | See 600 kHz series detail below |
| Dual-frequency 9-beam (1 MHz + 3 MHz + 500 kHz vertical) | 0.06–40 m profile / 80 m bathymetry | Shallow reservoirs, delta zones, moving-boat discharge + bathymetry in one pass | River-ADCP-M9 |
4.2 The 600 kHz Series: Four Instruments for Different Monitoring Scenarios
The 600 kHz class spans profiling ranges from 55 to 90 meters across four distinct instruments — each designed for a specific dam monitoring deployment. The table below maps each model to its optimal application.
| Model | Beams | Transducer | Profiling Range | Bottom Track | Accuracy | Built For |
|---|---|---|---|---|---|---|
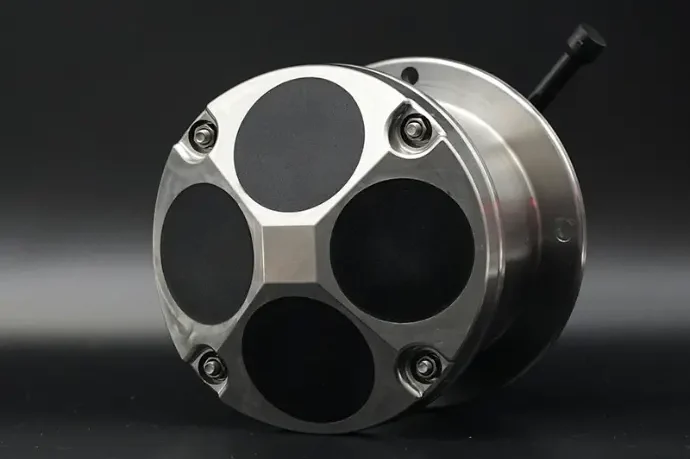
| Ocean-ADCP-600-FA4 | 4-beam Janus (20°) | Piston | 55 m broadband / 70 m narrowband | 0.8–120 m | ±0.3% ±3 mm/s | Pre-dam vertical profiling; direct-reading or self-contained mooring deployment. Titanium housing rated to 1000/3000/6000 m. |
| Ocean-ADCP-600-PA5 | 5-beam Janus | Phased array | 70 m | — | ±0.3% ±3 mm/s | Deep-water dam-face profiling with smaller, lighter form factor. Titanium housing to 6000 m. |
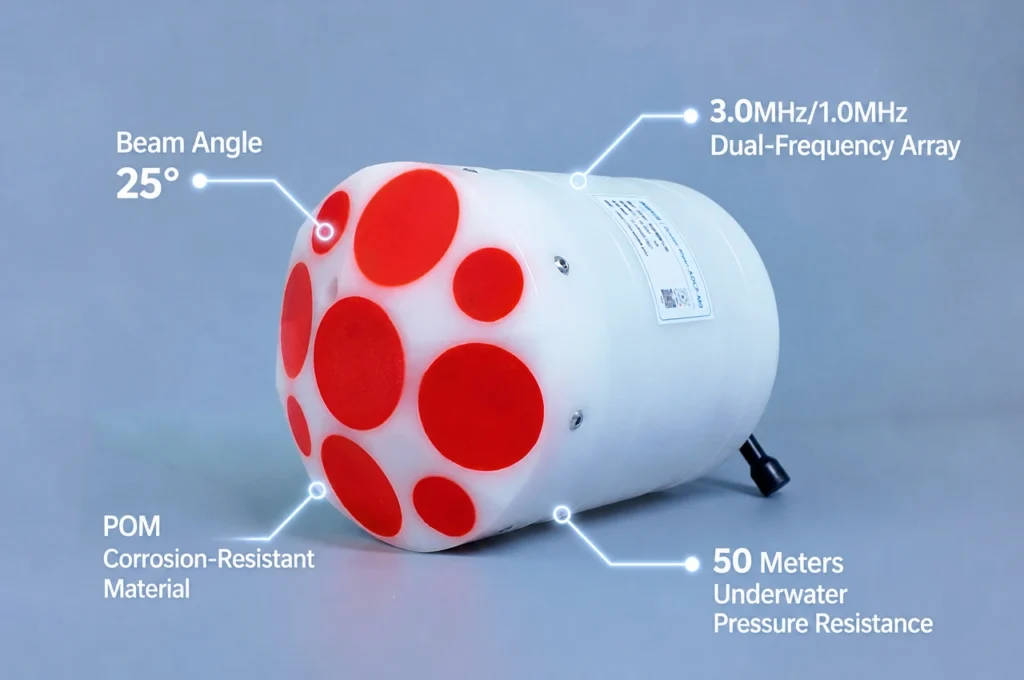
| River-ADCP-600-FA5 🆕 | 5-beam (4 Janus 20° + 1 vertical piston) | Piston | 50 m high-precision / 65 m long-range | 0.5–110 m | ±0.25% ±2 mm/s | Moving-boat discharge + bathymetry at reservoir inlets. Embedded GPS — no external antenna. POM housing, 50 m depth rating, ≤3.5 kg. |
| HADCP-600 | 3-beam | Piston | 90 m horizontal (cross-channel) | — | ±0.3% ±3 mm/s | Fixed bank-mounted horizontal monitoring across dam face or reservoir cross-section. Real-time, unattended, no moving parts. |
4.3 Deployment Configurations by Monitoring Objective
| Deployment | Monitoring Objective | Advantage | Limitation | Recommended Models |
|---|---|---|---|---|
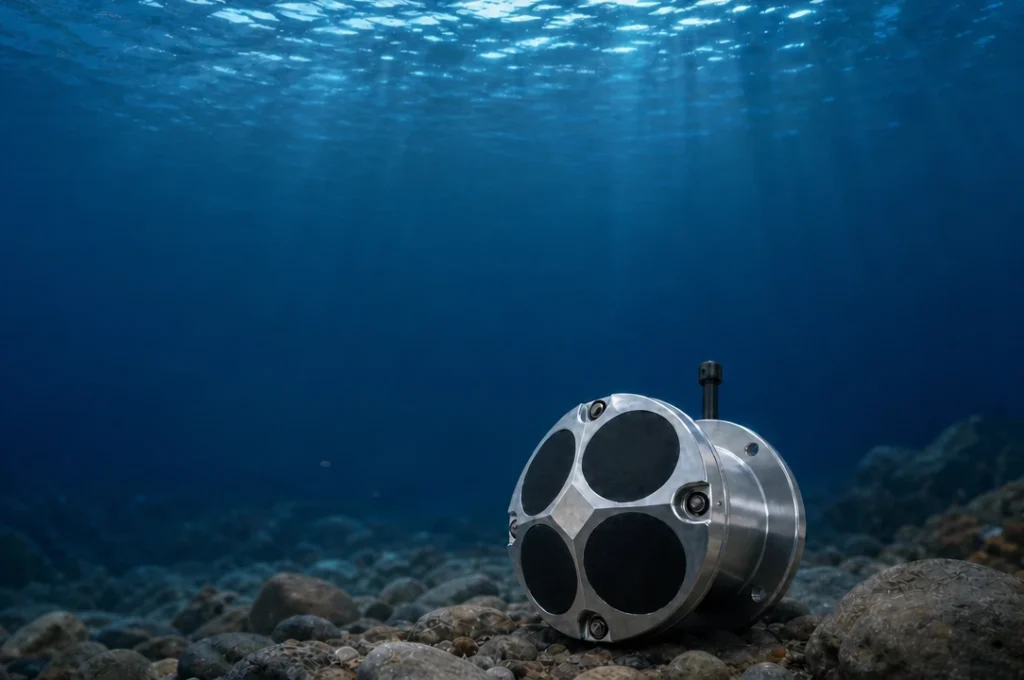
| Bottom-mounted fixed station | Long-term continuous SSC + velocity profile at a single location | Unattended operation; captures flood events; internal battery + 64 GB storage for multi-month deployments | Single-point data; maintenance requires diver or ROV | Ocean-ADCP-600-FA4 (self-contained config) |
| Side-looking fixed mount | Horizontal velocity profile across dam face or reservoir cross-section | Easy shore access for maintenance; real-time data via RS-232/422 telemetry; no obstruction to discharge gates | Single horizontal layer only | HADCP-600 |
| Moving-boat survey | Periodic discharge calibration, full cross-section SSC profiling, bathymetry | Spatially comprehensive; deployable from any vessel; simultaneous multi-parameter data collection | Requires operator presence; weather-dependent | River-ADCP-600-FA5, River-ADCP-M9 |
| USV-integrated | Dangerous or inaccessible survey zones (spillway apron, downstream scour holes) | Zero personnel risk; programmable survey lines; consistent survey speed improves data quality | Higher initial investment; limited to calm-to-moderate conditions | Ocean-ADCP-300-FA4 + USV platform |
4.4 Key Specifications for Dam Monitoring Applications
Beyond frequency and beam count, five specifications matter especially for dam safety and regulatory monitoring:
- Depth rating and housing: Select depth rating ≥ (maximum reservoir depth × 1.5 safety factor). For deep reservoirs (>100 m), titanium alloy housings rated to 1000 m, 3000 m, or 6000 m are available across the Ocean-ADCP series. For shallow reservoirs and inflow channels (≤50 m), POM (polyoxymethylene) housings on the River-ADCP-M9 and River-ADCP-600-FA5 provide a lighter, more cost-effective alternative.
- Bottom tracking: Essential for moving-boat discharge surveys. Verify bottom-track lock under soft sediment conditions common on reservoir beds — broadband coded-pulse bottom detection generally outperforms narrowband in mud substrates. The River-ADCP-600-FA5's 0.5–110 m bottom-track range covers the full span from inflow delta to deep pre-dam zones.
- Integrated sensors: For dam monitoring data that can withstand regulatory scrutiny, verify that the ADCP includes: temperature sensor (±0.1°C), pressure sensor (±0.25% FS for water level and depth validation), and compass/attitude sensor (heading ±0.8° RMS, roll/pitch ±1° for coordinate transformation accuracy).
- Data output format: Industry-standard PD0 binary format ensures compatibility with USGS QRev, WinRiver II, VMT, and other post-processing tools used in dam safety reporting workflows. All Oceantek ADCPs output PD0 via RS-232/RS-422 serial interfaces.
- Manufacturing quality and calibration traceability: For dam safety monitoring — where data integrity can directly affect regulatory compliance and public safety — instrument build quality matters as much as specifications. Oceantek ADCPs are manufactured under ISO 9001:2015 certified quality management, with each instrument undergoing factory calibration for compass heading, temperature, and pressure before shipment. This provides dam operators with traceable calibration baselines for their long-term monitoring programs.
5. Regulatory Compliance: What Dam Operators Need to Know
ADCP monitoring data serves two purposes in a dam safety program: operational decision support and regulatory compliance documentation. Understanding the standards and jurisdictional requirements that apply to your dam is essential for designing a monitoring program that satisfies both.
5.1 International Standards Framework
| Standard / Guideline | Scope | Key Requirements Relevant to ADCP Monitoring |
|---|---|---|
| ISO 24578:2021 | ADCP moving-boat discharge measurement method | Deployment procedures, data processing, uncertainty assessment for flow measurement in open channels from a moving boat |
| ISO 748:2021 | Velocity-area methods for open-channel flow | Foundational standard for point-velocity measurement and cross-section discretization; 5th edition |
| ICOLD Bulletin 158 | Dam surveillance and monitoring | Monitoring parameters, instrument selection criteria, data management, aging system maintenance, program effectiveness assessment |
| ICOLD Bulletin 147 | Reservoir sedimentation impacts and mitigation | Upstream/downstream morphological impacts of reservoir sedimentation; flushing, dredging, and bypass strategies |
| USGS TM 3-A8 | Moving-boat ADCP discharge measurement (USA) | Site selection, compass calibration (<0.5° error), moving-bed detection tests, data quality thresholds, post-processing QA |
| USACE EM 1110-2-4000 | Hydrographic surveying for USACE projects (USA, Feb 2025) | Sediment range line methodology; single-beam/multibeam/LiDAR selection criteria; accuracy standards for reservoir capacity computation; sub-bottom profiling for sediment thickness |
5.2 Monitoring Frequency by Jurisdiction
Regulatory monitoring schedules scale with dam hazard classification — higher-consequence dams face more frequent, more stringent requirements. The following comparison covers representative jurisdictions:
| Jurisdiction | Regulation / Guideline | Inspection Frequency | Comprehensive Safety Review |
|---|---|---|---|
| British Columbia, Canada | BC Dam Safety Regulation | Weekly site surveillance (very high/high consequence) → quarterly (low consequence) | Every 7–10 years |
| United Kingdom | Reservoirs Act 1975 (Sections 11–12) | Statutory monitoring and supervision duties; instrumentation readings per OMS manual; sediment depth surveys 1–10 years | Formal inspection by qualified engineer on prescribed schedule |
| Philippines | NIA Guidelines (PHRC-based) | Daily to weekly (high hazard) → annual (low hazard); special inspections after typhoons, floods, earthquakes (M>4.0 within 25 km) | Every 2 years (high) → 5 years (low) |
| New Zealand | NZSOLD Dam Safety Guidelines 2024 | Risk-informed; aligned with ICOLD international practice; modular framework (Modules 1–7) | Recommended (non-mandatory) best practice |
5.3 Compliance Checklist for Dam Operators Using ADCP Monitoring
The following seven-point checklist maps ADCP monitoring outputs to common regulatory requirements across jurisdictions:
- Establish sediment range lines — fixed cross-sections at key reservoir locations (delta, mid-pool, pre-dam). Set resurvey frequency based on sedimentation rate and consequence classification.
- Conduct moving-boat ADCP discharge surveys following the ISO 24578:2021 methodology — minimum four transects per session, compass calibration before each survey day with error <0.5°.
- Calibrate acoustic-backscatter SSC estimates with site-specific physical water samples (6–12 samples spanning a range of flow conditions). Recalibrate annually or after major sediment-transporting floods.
- Perform moving-bed tests before each moving-boat survey session when sediment transport on the reservoir bed is suspected.
- Integrate monitoring data into the annual dam safety report with trend analysis of reservoir capacity, discharge rating curves, and sedimentation rates.
- Notify the regulatory authority before making significant modifications to the monitoring instrumentation plan (e.g., BC Dam Safety Regulation requires 60 days' advance notice).
- Conduct event-triggered surveys after major floods, earthquakes, or spillway discharge events — these can transport more sediment in days than the annual average, and post-event bathymetry is a standard regulatory requirement in Philippine, Canadian, and UK frameworks.
6. Case Studies
Four operational case studies — spanning routine monitoring, sediment management intervention, flood-event capture, and long-term capacity assessment — illustrate how ADCP data supports the full dam safety lifecycle.
6.1 Routine Operations: Nibutani Dam, Japan
At the Nibutani Dam reservoir in Hokkaido, bottom-mounted ADCPs were deployed to observe flow dynamics during flood events with gate discharge. The measurements revealed a critical operational insight: when the orifice gate opens, water in the reservoir's bottom layer flows toward the dam body as a coherent density current, with turbidity increasing in tandem with bottom-layer velocity. This quantitative understanding of gate-influenced flow structure — unobtainable from surface observations or point measurements alone — informs gate operation protocols that balance flood discharge capacity against sediment entrainment into powerhouse intakes (IAHR / CERI).
6.2 Sediment Management: Chambon Dam, France (EDF)
The Chambon dam in the French Alps faced a direct safety threat: accumulated fine sediment was encroaching on the bottom outlet gate — the reservoir's primary safety device — and risked compromising both spillway discharge capability and gate operability. EDF conducted a dilution-pumping dredging operation and used a TRDI RioGrande 600 kHz ADCP tilted 20° (Beam 1 pointing to nadir, to avoid side-lobe perturbation near the bottom) to verify its effectiveness. By mapping acoustic backscatter intensity across the dredging zone, the survey team distinguished areas of no-, low-, and high-sediment concentration in the plume, confirming that fine sediments were being successfully entrained toward the power-plant intake for controlled release. The ADCP data provided spatially resolved, near-real-time verification that a point-sampling program could not (Hauet et al., EGU 2022).
6.3 Flood-Event Monitoring: Banja Hydropower Plant, Albania
On the Devoll River in Albania, the Banja HPP reservoir is fed by a catchment where floods carry the majority of the annual sediment load — but conventional sampling methods are dangerous and often impossible during peak flows. The monitoring solution: two side-looking ADCPs (600 kHz and 1200 kHz) installed as a fixed station with automated data transmission to a remote server. Using an analytical method based on the sonar equation expressed as an attenuation-backscatter ratio, the system continuously quantifies flow discharge, water level, and suspended sediment concentration — specifically optimized to capture flood events that traditional sampling would miss. A graphical user interface was developed for interpreting echo profiles, making the system accessible to dam operators without specialized acoustics training (Guerrero et al., IAHR / Taylor & Francis).
6.4 Long-Term Capacity Assessment: Three Gorges Reservoir, China
The Three Gorges Reservoir on the Yangtze River — the world's largest hydropower project by installed capacity — has been monitored for sedimentation since impoundment in June 2003 using the repeat cross-section (section) method. As of November 2017, the Changjiang Water Resources Commission reported 1.48 billion m³ of net sediment deposition within the reservoir. Critically, sedimentation within the 145–175 m flood-control zone was only 0.125 billion m³ — a flood storage capacity loss of just 0.56% over 14 years. This figure is far below the original design projections because upstream sediment supply declined sharply (annual load fell from ~490 million tonnes in the 1956–1990 period to ~34 million tonnes by 2017). The Three Gorges case underlines a principle applicable to all dam monitoring programs: sedimentation projections made at the design stage must be validated — and updated — with measured data throughout the operational life of the dam (CWRC).
7. Implementation Roadmap: Building a Dam ADCP Monitoring Program in 5 Steps
Whether you are starting from scratch or upgrading an existing conventional monitoring program, the following five-phase roadmap provides a structured path from assessment to operational integration.
| Phase | Duration | Key Activities | Deliverables |
|---|---|---|---|
| 1. Assessment | 1–2 months | Review historical bathymetric surveys and capacity curves; identify sediment delta position and rate of advancement; map regulatory requirements (jurisdiction, consequence class); define monitoring objectives (discharge rating validation, SSC trending, capacity assessment, or all three) | Gap analysis report: current monitoring vs. regulatory requirements and operational needs |
| 2. Equipment Selection | 1 month | Select ADCP frequency by maximum reservoir depth (Section 4.1); choose deployment configuration (Section 4.3); procure instrument + mounting hardware + telemetry; plan calibration logistics (physical water sampling equipment, lab access) | Equipment procurement list; deployment plan with site coordinates; calibration protocol |
| 3. Baseline Survey | 1–2 weeks | Complete first full moving-boat discharge survey (≥4 transects); collect physical water samples at 6–12 points for backscatter-SSC calibration; conduct simultaneous bathymetric survey at sediment range lines; establish baseline capacity curve | Baseline data set: discharge, SSC calibration curve, reservoir capacity at reference water level; field SOP documentation |
| 4. Routine Monitoring | Ongoing | Execute prescribed survey schedule (frequency per regulatory requirement); maintain fixed-station instruments (cleaning, battery replacement, data download); log all instrument maintenance for audit trail; verify calibration annually | Continuous time-series data from fixed stations; periodic survey reports; instrument maintenance logs |
| 5. Annual Review | Annual | Update reservoir capacity curves; compute annual sedimentation rate and compare to design projections; trend analysis of discharge rating curves; review monitoring program effectiveness; adjust monitoring frequency or instrumentation as needed | Annual dam safety monitoring report; updated capacity curves; program improvement recommendations |
8. Frequently Asked Questions
Q: What is the best ADCP frequency for dam reservoir monitoring?
The optimal ADCP frequency depends on reservoir depth. For deep reservoirs (>200 m), 75 kHz phased-array ADCPs reach up to 650 m profiling range. For medium reservoirs (50–200 m), 300 kHz models profile to 160 m. For shallow reservoirs and inflow channels (<70 m), the 600 kHz series offers profiling ranges from 55–90 m with higher resolution — including the 5-beam River-ADCP-600-FA5 for moving-boat discharge with integrated bathymetry, and the HADCP-600 for fixed horizontal monitoring across 90 m of reservoir cross-section. For moving-boat surveys in sediment-laden inflow zones, the dual-frequency 9-beam River-ADCP-M9 switches between 1 MHz for high resolution and 3 MHz for deeper penetration, with an independent 500 kHz vertical beam for simultaneous bathymetry.
Q: How accurate is ADCP for suspended sediment concentration measurement?
ADCP-derived SSC accuracy depends on site-specific calibration. When acoustic backscatter is calibrated against physical water samples, typical correlation coefficients exceed R² = 0.85. The key uncertainty driver is variation in suspended particle size distribution, which changes the specific attenuation coefficient. Multi-frequency ADCP systems can partially distinguish particle size classes. For dam compliance monitoring, the standard practice is to collect physical water samples at 6–12 points across a range of flow conditions, establish a site-specific calibration curve, then use the ADCP for continuous monitoring between sampling campaigns.
Q: Can ADCP replace traditional bathymetric surveys for reservoir capacity assessment?
ADCP provides complementary capability rather than a full replacement. The River-ADCP-M9's vertical 500 kHz beam measures bathymetry to 80 m depth with 0.02% accuracy after sound-speed correction — sufficient for routine capacity monitoring in shallow to medium reservoirs. However, for regulatory-grade reservoir capacity certification, multibeam echo sounder surveys remain the gold standard. The practical approach recommended in USACE EM 1110-2-4000 is to use ADCP moving-boat surveys for annual capacity trending, supplemented by full multibeam surveys every 5–10 years as required by dam safety regulations.
Q: What are the regulatory requirements for dam discharge monitoring?
Requirements vary by jurisdiction. ISO 24578:2021 and ISO 748:2021 define the international ADCP moving-boat discharge measurement methodology. In Canada (BC), the Dam Safety Regulation mandates weekly site surveillance for high-consequence dams and comprehensive safety reviews every 7–10 years. In the UK, the Reservoirs Act 1975 imposes statutory monitoring and supervision duties. The Philippines NIA Guidelines tie inspection frequency to hazard classification levels. ICOLD Bulletin 158 provides international best-practice guidance on monitoring instrumentation, data management, and program assessment applicable across all jurisdictions.
Q: How often should reservoir sedimentation surveys be conducted?
International practice ranges from 1 to 10 years depending on sedimentation rate, reservoir size, and consequence classification. USACE EM 1110-2-4000 (2025) recommends sediment range line surveys at key cross-sections as a low-cost method to monitor delta advancement between full reservoir surveys. For reservoirs with high sedimentation rates (>1% annual capacity loss), annual surveys are recommended. After major flood events, additional surveys should be conducted regardless of the regular schedule — floods carry the majority of annual sediment load and can significantly alter reservoir bathymetry in days.
Q: What is the difference between moving-boat and fixed-station ADCP deployment?
Moving-boat deployment uses a vessel-mounted ADCP following the ISO 24578 methodology to measure discharge across the entire reservoir cross-section, typically completing 4 or more transects per survey. It provides spatially comprehensive data but requires operator presence. Fixed-station deployment uses a bottom-mounted or side-looking ADCP installed permanently at a strategic location to provide continuous, unattended time-series data. This captures flood events and diurnal variations that scheduled surveys miss. Modern dam monitoring programs often combine both: fixed stations for continuous surveillance and periodic moving-boat surveys for spatial coverage and calibration verification.
Q: How do I calibrate an ADCP for suspended sediment monitoring in a reservoir?
The calibration process follows four steps. First, deploy the ADCP to collect acoustic backscatter data (in counts or dB) at the monitoring location. Second, simultaneously collect physical water samples at multiple depths using a point-integrating sampler or pump sampler — aim for 6–12 samples spanning low to high concentration conditions. Third, measure the SSC of each sample gravimetrically in the lab, and optionally analyze particle size distribution. Fourth, regress the ADCP backscatter against measured SSC to establish a site-specific calibration curve, typically using a power-law or log-linear relationship after correcting for acoustic transmission losses using the sonar equation. Recalibrate annually or after major floods, as changes in sediment source and particle size can shift the calibration.
Q: What are the ICOLD guidelines for dam instrumentation monitoring?
ICOLD Bulletin 158 — Dam Surveillance Guide (2018) provides the primary international framework for dam monitoring instrumentation. Key recommendations include: routine visual inspection supplemented by instrumented monitoring; systematic checking and testing of hydro-electromechanical equipment; parameter-specific monitoring programs with defined alert thresholds; automated data acquisition where continuous monitoring is required; maintenance and periodic re-instrumentation of aging monitoring systems; structured data management with documentation of all monitoring records; and regular assessment of dam condition and behaviour by qualified dam safety engineers. ICOLD Bulletin 147 specifically addresses reservoir sedimentation, covering upstream and downstream fluvial morphological impacts and mitigation measures including flushing, dredging, and sediment bypass systems.
9. Conclusion
Reservoir sedimentation is irreversible but entirely manageable — provided it is measured. ADCP technology is the only instrument class that simultaneously addresses the three pillars of dam monitoring: discharge measurement for operational decision-making and rating-curve validation, suspended sediment flux monitoring for sedimentation management and turbine protection, and bathymetric trending for storage capacity assessment and regulatory compliance.
From the 75 kHz phased-array Ocean-ADCP-75-PA4 profiling to 650 m in deep reservoirs, through the 600 kHz series spanning 55–90 m across four instrument variants for vessel-mounted, fixed-station, and horizontal monitoring, to the dual-frequency 9-beam River-ADCP-M9 delivering simultaneous discharge, sediment, and bathymetry in a single moving-boat pass — Oceantek provides a frequency and deployment configuration for every dam monitoring scenario. All instruments are manufactured under ISO 9001:2015 certified quality management at our Hangzhou facility and output the industry-standard PD0 data format compatible with USGS QRev, WinRiver II, and VMT post-processing workflows.
Whether you are building a monitoring program from first principles, upgrading from mechanical current meters, or adding continuous sediment monitoring to an existing bathymetric survey program, the equipment selection framework, calibration protocols, and regulatory compliance checklist in this guide provide a structured path from assessment to operational integration.
Disclosure: Oceantek designs and manufactures acoustic Doppler current profilers and Doppler velocity logs at its ISO 9001:2015 certified facility in Hangzhou, China. The product recommendations in this article reflect Oceantek's instrument portfolio, selected to illustrate the frequency-deployment matching principles applicable to any ADCP brand. References to TRDI and other manufacturers in case studies reflect actual instruments used at those sites.
Last updated: August 8, 2026.