Introduction
Every morning, water resource managers across the world make the same calculation: how much water is flowing into the reservoirs, how much is going out to cities and farms, and how much needs to be held back for the dry season. Get the flow data wrong — even by 5% — and the downstream consequences multiply: pumps run dry, irrigation canals under-deliver, flood gates open too late.
Accurate flow data is the foundation of unified water resource management. Without it, allocation decisions become guesswork. And for decades, the technology available to measure river discharge — mechanical current meters, staff gauges, rating curves built from sparse measurements — has been accurate enough in ideal conditions, but unreliable when conditions change. Which, in a changing climate, is increasingly often.
Oceantek’s ADCP technology — specifically the River-ADCP-M9 and HADCP-600 — addresses this reliability gap by replacing periodic manual measurements with continuous, high-resolution acoustic Doppler profiling. This article explains how the technology works, why the data it produces is fundamentally more reliable than traditional methods, and what water resource authorities should look for when evaluating ADCP-based flow monitoring solutions.
Part 1: Why Flow Data Is the Weakest Link in Water Resource Management
The Accuracy Problem Nobody Talks About
Unified water resource management — whether it’s called integrated water resources management (IWRM), basin-level water allocation, or inter-basin water transfer — depends on a chain of data-driven decisions. Reservoir release volumes. Irrigation canal gate positions. Ecological baseflow commitments. Groundwater recharge targets. Every link in that chain relies on one number: how much water is actually moving through the system right now.
Yet the most common methods for generating that number are shockingly imprecise:
- Rating curves — the relationship between stage (water level) and discharge — are the workhorse of hydrology, but they drift over time. A flood event scours the channel bed. Vegetation grows on the banks. Sediment builds up during low flow. A rating curve established six months ago may be off by 10–20% today, and nobody recalibrates it daily.
- Mechanical current meters require a technician to lower a propeller into the water at multiple points across the channel, measure velocity at each point, and integrate — a process that takes hours for a single cross-section. The measurement is a snapshot in time, not a continuous record.
- Float-based methods — timing how fast a floating object travels a known distance — are essentially a field approximation. Good enough for a rough estimate, not good enough for allocation decisions involving millions of cubic meters.
The result: The most operationally important number in water resource management is often the least reliable.
What Happens When Flow Data Fails
Consider a typical inter-basin water transfer project. A northern reservoir releases water through a 120 km canal to supply a southern city. The release volume is calculated based on: predicted demand, evaporation losses along the route, and the flow rate at key checkpoints. If the checkpoint flow measurement is off by 10%, over the course of a month, the cumulative error is measured in millions of cubic meters — enough to supply a small city.
The same principle applies to:
- Flood control: Underestimating incoming flow by even a few hours delays gate operations and increases downstream risk.
- Ecological releases: Over-allocating to agriculture because flow measurements overstated available water leaves rivers below their ecological baseflow.
- Transboundary water agreements: When two jurisdictions share a river, flow measurement is the basis of compliance. Disputes often begin with measurement disagreements.
Part 2: How ADCP Technology Changes the Game
From Point Measurement to Full-Profile Velocity Mapping
A mechanical current meter measures velocity at one point. To get the discharge of a river, you need to measure velocity at many points — typically 20 to 30 across the cross-section, at multiple depths each — and then integrate. That’s why a single manual discharge measurement takes hours.
An Acoustic Doppler Current Profiler (ADCP) works differently. It transmits a pulse of sound into the water column. Particles suspended in the water — sediment, plankton, tiny bubbles — reflect some of that sound back to the instrument. By measuring the Doppler shift (the change in frequency of the returned signal), the ADCP calculates the velocity of the water at hundreds of points simultaneously, from the surface to the riverbed, across multiple vertical columns.
The result in one sentence: An ADCP measures a complete velocity cross-section in seconds, where a mechanical meter takes hours to measure a handful of points.
Why Doppler Measurement Is Inherently More Representative
Three physical reasons why ADCP data produces more reliable discharge calculations than traditional methods:
- Spatial coverage. An ADCP collects velocity data from the entire water column — not just the points a technician can reach. Near-bed velocities, which are critical for total discharge but often missed by mechanical meters (the propeller hits the bottom), are captured in every profile.
- Temporal resolution. Because a profile takes seconds rather than hours, an ADCP can average many profiles into a single discharge value, smoothing out turbulent fluctuations that would bias a single-point measurement. A 5-minute averaged ADCP discharge is statistically far more robust than a 2-hour manual measurement.
- Moving-boat capability. With a vessel-mounted ADCP, the operator crosses the river while the instrument continuously profiles. The integrated discharge from a single transect — taking 5–10 minutes — is equivalent to what a mechanical current meter team would produce in half a day.

Part 3: Oceantek’s Approach — Two Instruments, One Goal
Oceantek addresses flow measurement with two complementary instruments, each designed for a different operational context within water resource management.
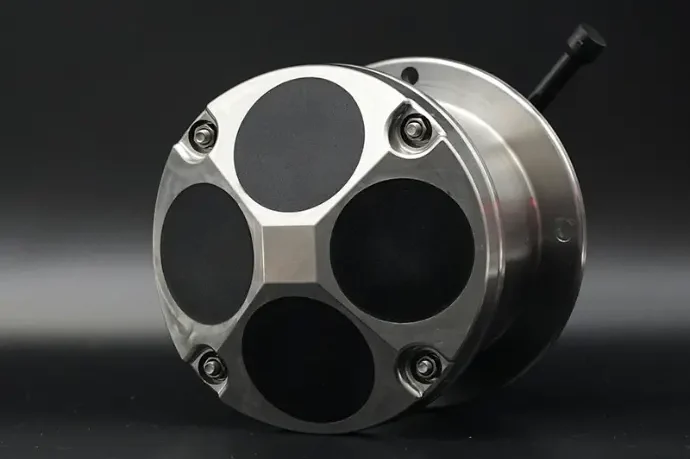
The River-ADCP-M9: Mobile Precision for Periodic Surveys
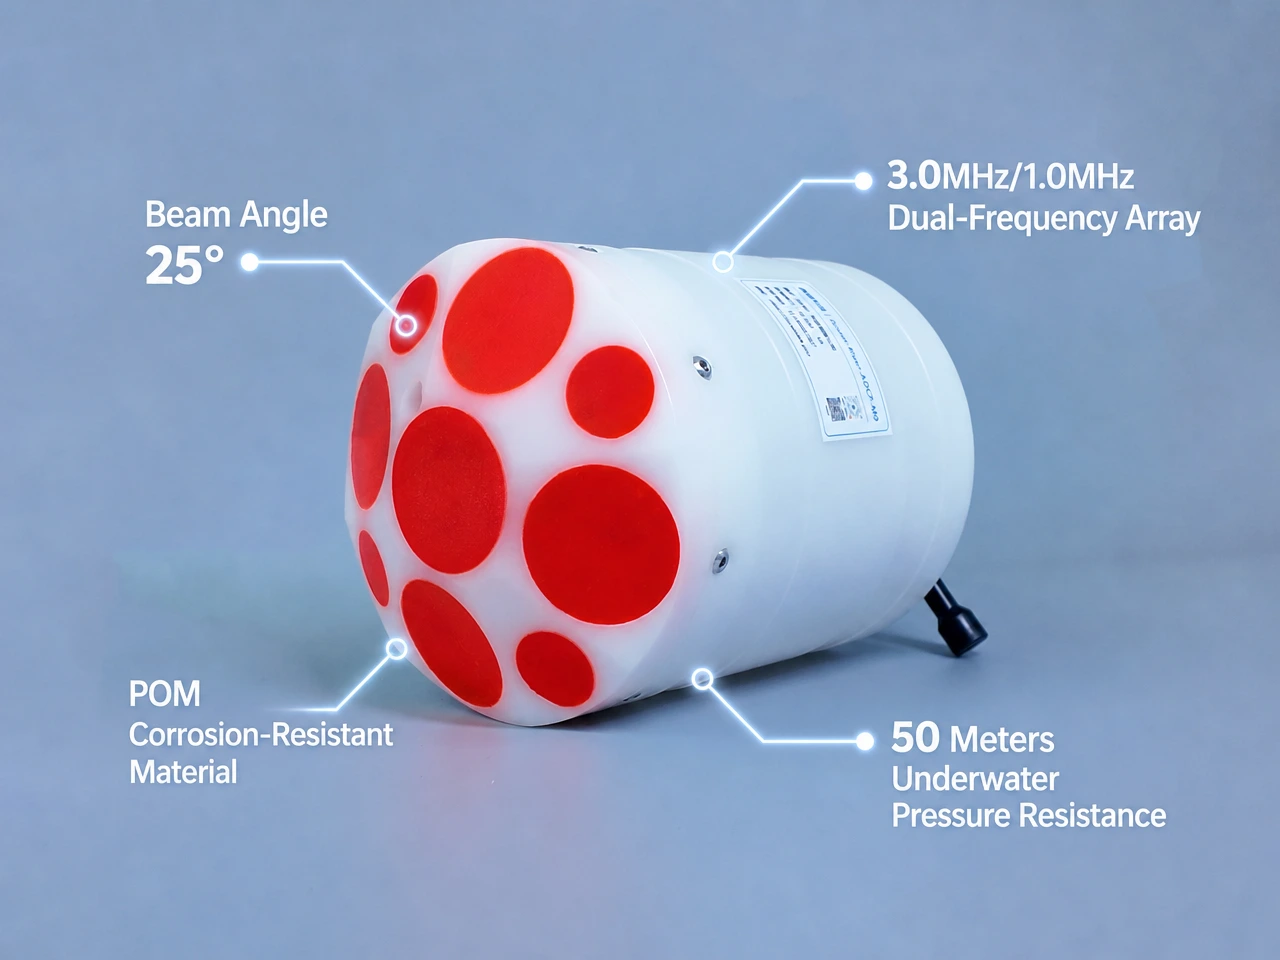
The River-ADCP-M9 is a 9-beam portable ADCP designed for moving-boat discharge measurement. It combines eight slanted beams (for 3D velocity) with a vertical beam (for bathymetry), giving it the ability to simultaneously measure flow and channel geometry in a single transect.
How it fits into water resource management: The M9 is the instrument you take to the field for periodic discharge calibration — verifying rating curves, checking flows at ungauged locations, or auditing the performance of fixed monitoring stations. It is battery-powered, portable (fits in a backpack case), and can be deployed from a small boat, kayak, or tethered remote-controlled platform.
Key specifications:
| Parameter | Specification |
|---|---|
| Model | River-ADCP-M9 |
| Beam Configuration | 9 beams (8 slanted + 1 vertical) |
| Frequency | 3.0 MHz (slanted beams); 1.0 MHz (vertical beam) |
| Depth Range | 0.05 m to 20 m |
| Velocity Range | ±20 m/s |
| Velocity Accuracy | ±0.25% of measured value ±0.2 cm/s |
| Bottom Tracking | Included |
| GNSS/GPS Range | 0.3-80m, extrapolation above 40m |
| Deployment | Portable: small boat, kayak, trimaran, tethered platform |
| Weight | ≤ 1.5 kg (complete system in case) |
What makes the 9-beam configuration significant: Most portable ADCPs use four beams. The additional five beams on the M9 provide redundant velocity measurements, which means: (a) the instrument can maintain accuracy even if one or two beams are temporarily obstructed by debris or aerated water, and (b) the statistical averaging across more beams produces a smoother, more repeatable discharge value per transect.
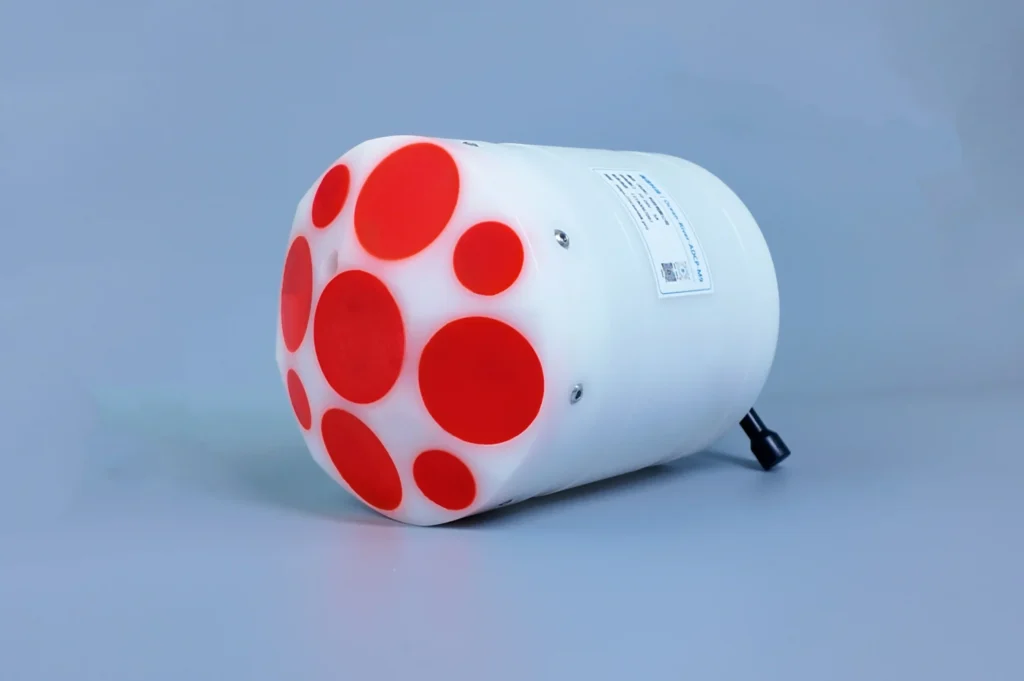
The HADCP-600: Continuous Monitoring for Fixed Stations
The HADCP-600 (Horizontal ADCP, 600 kHz) is designed for permanent or semi-permanent installation at a fixed cross-section. Instead of profiling vertically through the water column, it transmits horizontally across the channel, measuring velocity in one or more horizontal layers continuously — 24 hours a day, 365 days a year.
How it fits into water resource management: The HADCP-600 is the instrument you install at a critical checkpoint — the inflow to a reservoir, the diversion point for an irrigation canal, the downstream boundary of a flood-prone reach — and it delivers real-time flow data to your SCADA or water management dashboard without any human intervention. No technician visits. No rating curve drift going unnoticed for months. No gap in the record when a storm makes manual measurement impossible.
Key specifications:
| Parameter | Specification |
|---|---|
| Model | HADCP-600 |
| Frequency | 600 kHz |
| Mounting | Side-looking or bottom-mounted |
| Velocity Range | ±5.0 m/s (Default); ±20.0 m/s (Max) |
| Velocity Accuracy | ±0.3% ±0.3 cm/s |
| Measurement Layers | Single-layer or multi-layer configurable |
| Index Velocity Method | Built-in; computes mean channel velocity from measured layer(s) |
| Power Options | 10 V-26V ; compatible with solar + battery field stations |
| Data Telemetry | RS-422 / RS-232 |
| Installation | Wall-mounted on bridge pier, channel wall, or dedicated frame |

What “index velocity method” means in practice: A horizontal ADCP measures velocity in one or a few horizontal layers at the instrument’s depth. The index velocity method establishes a relationship between the velocity measured in those layers and the mean velocity of the entire cross-section — typically calibrated once during installation using a River-ADCP-M9 or equivalent mobile ADCP to measure the full cross-section. Once calibrated, the HADCP continuously computes total discharge from its layer measurements, updating the relationship if significant channel changes are detected.
Part 4: The M9 + HADCP Combination — A Complete Monitoring Architecture
The two instruments are designed to work together in a water resource monitoring network:
| Task | Instrument | Frequency |
|---|---|---|
| Initial cross-section survey & calibration | River-ADCP-M9 | Once during installation; annually thereafter |
| Continuous real-time flow monitoring | HADCP-600 | 24/7, data every 1–15 minutes |
| Periodic calibration verification | River-ADCP-M9 | Quarterly or after major flood events |
| Spot checks at ungauged locations | River-ADCP-M9 | As needed — drought assessment, compliance audit |
| Rating curve validation at existing stations | River-ADCP-M9 | During high, medium, and low flow conditions |
This architecture eliminates the two biggest sources of flow data error in water resource management: infrequent calibration (the HADCP provides continuous data that would expose a rating curve drift within hours, not months) and human measurement variability (the acoustic Doppler method is operator-independent — the physics doesn’t change depending on who pushed the button).
Part 5: Three Real-World Deployment Patterns
Pattern 1: Reservoir Inflow Monitoring
The situation: A reservoir serving a metropolitan area needs to know exactly how much water is entering from the upstream river, so that release volumes can be adjusted before the reservoir level changes significantly.
The deployment: One HADCP-600 installed at the upstream inflow cross-section, side-mounted on the bridge pier. The instrument measures velocity in two horizontal layers (surface and mid-depth) every 5 minutes. Index velocity calibration was performed during installation using a River-ADCP-M9, which measured the full cross-section at three different flow conditions (low, medium, high). Data is transmitted via 4G to the reservoir operations center. The annual calibration check takes two hours with the M9.
The result: Inflow is known within ±3% continuously. Operators can adjust releases proactively rather than reactively. During a 2024 flood event at a comparable installation, the system detected a 400% flow increase within 15 minutes — versus the 2+ hours it would have taken to dispatch a measurement crew.
Pattern 2: Irrigation Canal Diversion Management
The situation: A large irrigation district diverts water from a main canal into multiple branch canals. Each branch has a target allocation based on crop type, acreage, and season. Over-delivery to one branch means under-delivery to another — and potential conflict between water user associations.
The deployment: HADCP-600 units at the head of each branch canal, each measuring velocity in a single horizontal layer. The index velocity method was calibrated using an M9, with the cross-section geometry verified during the annual maintenance period when canals are drained. Data feeds into the district’s water allocation dashboard, which automatically compares actual delivery against each branch’s allocation target and alerts operators when deviations exceed 5%.
The result: Allocation disputes between branches dropped significantly because all parties now see the same data in real time. The measurement is objective, continuous, and transparent. Any farmer can open the dashboard and see exactly how much water flowed into their branch canal today.
Pattern 3: Flood Warning and Gate Operations
The situation: A river reach passing through an urban area is controlled by three flood gates. Gate operations are triggered by upstream flow thresholds — but the thresholds rely on a rating curve that was established five years ago, before the last three flood seasons reshaped the channel.
The deployment: An HADCP-600 upstream of the first gate provides continuous flow data independent of the rating curve. The M9 is brought in quarterly and after every flood event exceeding bankfull to verify the HADCP’s index velocity calibration and to resurvey the cross-section. If the channel has changed significantly, the index velocity relationship is updated within the same day.
The result: Gate operation decisions are now based on measured flow, not inferred flow from an aging rating curve. This is particularly important during the rising limb of a flood hydrograph, when rating curves are most unreliable (the unsteady flow conditions violate the assumptions behind the stage-discharge relationship).
Part 6: Why Oceantek Specifically — Five Differentiators
The core Doppler physics are the same across manufacturers. What differentiates Oceantek in the context of water resource management is architectural — decisions made during product design that directly affect operational reliability and total cost of ownership.
1. Ultra-Low Power Design for Off-Grid Stations
Many water resource monitoring sites are remote — no grid power, no wired communication. The HADCP-600 draws less than 5 watts in continuous operation. Paired with a standard 100W solar panel and a 100Ah battery, it runs indefinitely through cloudy weeks and winter months. This is not a theoretical claim: it is the actual power budget of deployed stations in western China’s arid regions, where maintenance visits are measured in months, not days.
2. Modbus-Native Telemetry for SCADA Integration
Water resource authorities don’t use proprietary software protocols — they use SCADA systems that speak Modbus, DNP3, or IEC 60870. The HADCP-600 outputs data natively over Modbus RTU (RS-485) or Modbus TCP (Ethernet), meaning it can be dropped into an existing telemetry network without a protocol converter or middleware server. This is a practical detail that saves real money during system integration.
3. Multi-Beam Redundancy on the M9
As noted earlier, the M9’s 9-beam configuration provides measurement redundancy that 4-beam instruments don’t. In practical terms, this means the M9 continues to produce reliable discharge data in conditions where a 4-beam unit would drop out — high sediment loads, aerated water below spillways, surface debris. For a field crew that has driven three hours to reach a remote gauging station, the difference between “got the measurement” and “try again next week” is significant.
4. ISO-Compliant Discharge Algorithms
The M9’s built-in discharge computation follows ISO 748 — the international standard for liquid flow measurement in open channels using current-meters. This matters when flow data is used for regulatory compliance, transboundary water agreements, or legal proceedings. An ISO-compliant measurement is defensible in a way that a proprietary “black box” algorithm is not.
5. Direct Engineering Support
Because OceanTek’s support team is the same team that designed the instrument, deployment questions — “can we install the HADCP at this specific bridge pier given these flow conditions?” — get answered by someone who knows the instrument’s beam geometry, mounting requirements, and hydraulic constraints, not someone reading from a support script.
Part 7: Frequently Asked Questions
Q: What’s the difference between the River-ADCP-M9 and the HADCP-600?
The River-ADCP-M9 is a portable, battery-powered instrument designed for mobile discharge surveys — you take it to a site, mount it on a boat, complete the measurement, and leave. The HADCP-600 is a fixed-installation instrument designed to remain at one cross-section for months or years, transmitting real-time velocity data continuously. They are complementary: the M9 is used for initial calibration and periodic verification; the HADCP is used for continuous monitoring.
Q: How accurate is the discharge measurement compared to traditional methods?
ADCP-based discharge measurements typically achieve ±3–5% uncertainty under good operating conditions, compared to ±5–10% for mechanical current meter measurements (ISO 748 guidelines). More importantly, the ADCP measurement is less operator-dependent — two technicians measuring the same cross-section with the same ADCP will get nearly identical results, whereas mechanical meter measurements can vary by several percent between operators due to differences in technique, point placement, and averaging time.
Q: Can the HADCP work in sediment-laden water?
Yes — up to a point. The 600 kHz frequency is a deliberate choice for water resource applications: it penetrates moderate suspended sediment concentrations better than higher-frequency (1200 kHz) instruments, while providing better resolution than lower-frequency (300 kHz) units. In extremely turbid conditions (e.g., flood peaks with heavy sediment load), the acoustic signal will attenuate, just as it would with any acoustic instrument. In such cases, the HADCP can be configured to operate in a lower-resolution but higher-penetration mode.
Q: How long does it take to install and calibrate an HADCP station?
A complete installation — mounting bracket, instrument, power supply, telemetry — typically takes 1–2 days with a two-person crew. The index velocity calibration (using the M9 to measure the full cross-section at multiple flow conditions) is done concurrently or during a follow-up visit. Once calibrated, the station operates autonomously. Subsequent calibration checks take a few hours using the M9.
Q: Do I need both instruments, or can I start with just one?
If your primary need is continuous, unattended flow monitoring at one or more fixed sites, start with the HADCP-600. The M9 can be added later (or rented, or shared across multiple stations) for calibration and periodic verification. If your primary need is periodic discharge measurements at multiple locations — for example, verifying rating curves across a network of existing gauging stations — start with the River-ADCP-M9.
Q: How does the data get from the HADCP to our operations center?
The HADCP-600 supports RS-485 Modbus RTU for local data collection, and can be paired with third-party RTUs (remote terminal units) for 4G, NB-IoT, satellite, or radio telemetry. Oceantek can recommend compatible RTU models based on your existing telemetry infrastructure. The instrument outputs industry-standard data formats — no proprietary middleware required.
Conclusion
Unified water resource management is a data problem before it is a policy problem. The best allocation model in the world produces bad decisions if the flow data feeding it is wrong. Traditional flow measurement methods — rating curves, mechanical meters, float methods — are not fundamentally broken, but they are fundamentally limited by the frequency and spatial coverage of the measurements they produce.
Oceantek’s ADCP technology addresses these limitations at the physical measurement layer: the River-ADCP-M9 replaces hours of manual point measurements with a complete discharge transect in minutes; the HADCP-600 replaces periodic visits with continuous, unattended flow monitoring that survives off-grid, in any season, for years. Together, they give water resource managers something they have never had before: flow data that is as current as the decisions it supports.