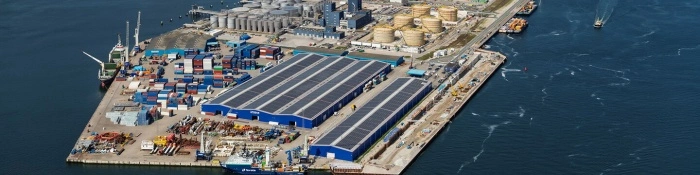
San Francisco Bay (NOAA PORTS)
California, USA
San Francisco Bay has hosted the reference implementation of real-time port current measurement since 1998: NOAA's Physical Oceanographic Real-Time System (PORTS). Fixed stations from the Golden Gate to Port Chicago deliver what a tide table never can — what the water is doing right now.
01 THE SETTING
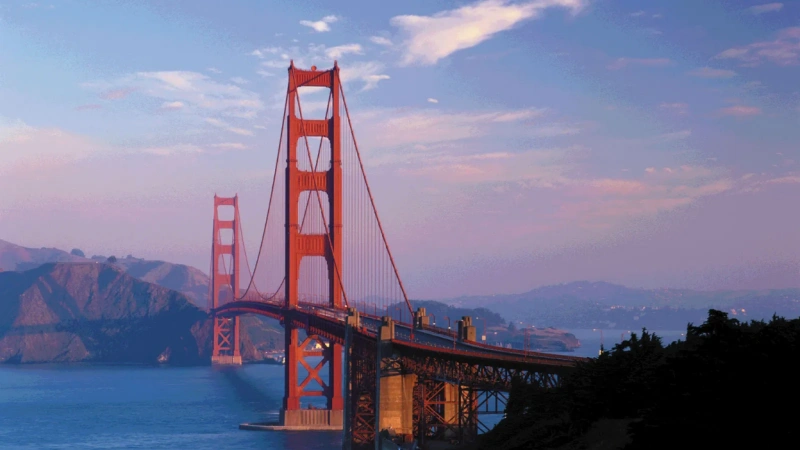
San Francisco Bay is a demanding operating environment: a deep, narrow entrance at the Golden Gate, shallow shipping channels through the bay itself, strong tidal exchange, and some of the highest-value maritime traffic on the US West Coast. In 1998, NOAA's National Ocean Service installed PORTS here as one of its flagship systems — built around a premise that has since become industry doctrine: the maritime community needs what is happening now, not what a tide table predicted.
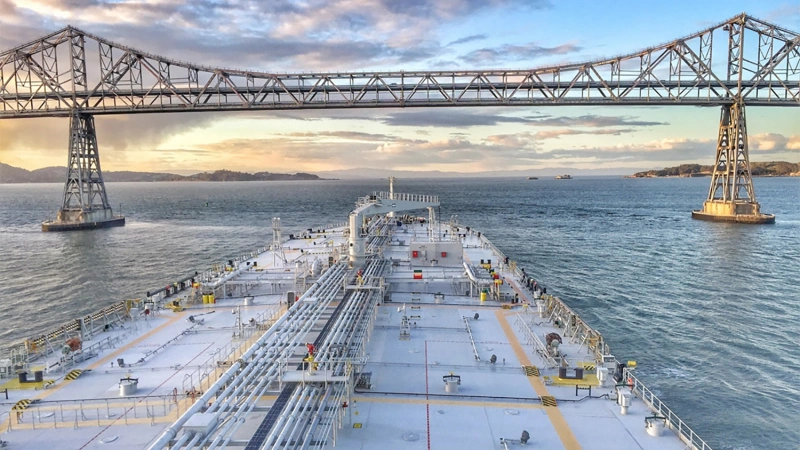
The system spans the full geography of the bay — from the Golden Gate through Alameda and Richmond, south to Redwood City, and inland to Port Chicago — reporting continuously, with mariners able to check conditions by web or phone before they ever enter the water.
02 WHAT THE DATA SHOW
- Water levels — tide gauges at fixed stations, with the Golden Gate gauge as the reference from which model-based levels elsewhere are derived;
- Currents — current stations reporting stage as Flood, Slack or Ebb — the pilot's native vocabulary;
- Meteorology — wind speed and direction, air pressure and air temperature at key positions;
- Water properties — conductivity, salinity and temperature at surface and bottom, capturing the bay's strong estuarine stratification.
The geography matters more than the sensor list. The Golden Gate channel exceeds 110 m depth at its center, while most port channels are around 15 m — two entirely different current regimes inside one system, which is why the station mix covers both.
03 WHERE CURRENTS THREATEN OPERATIONS
Pilotage & navigation
Pilots time transits and plan maneuvers on measured current stage; vessels entering from the Pacific get the Gate's actual conditions before commitment.
Emergency response
During the 1996 Cape Mohican oil spill, real-time tide and current information supported tactical deployment of cleanup equipment — the system's first major operational test.
Anomaly detection
In 1998, El Niño pushed tides two feet above predictions; measured values, not predicted ones, were what mattered to every vessel drafting through the shallow reaches.
Forecast anchoring
The SFBOFS forecast model is validated against PORTS measurements — the classic pattern of fixed current stations anchoring a forecast chain that extends their reach.
04 MEASUREMENT STRATEGY BY STATION TYPE
| Station Type | Location | Approach |
|---|---|---|
| Narrow-section real-time flow | Channel constrictions, port entrances | Side-looking horizontal ADCP on walls and piers, outputting flood/slack/ebb stage |
| Point stations | PORTS-style fixed positions | Single-point current meters paired with level and water-quality sensors |
| Shallow-channel profiling | 15 m shipping channels | Bottom-mounted 600 kHz profilers where the bay's traffic actually drafts |
| Deep Golden Gate section | The 110+ m entrance | Buoy-borne profiler, telemetered and storm-survivable |
05 THE OCEANTEK SOLUTION
Wall-mounted cross-flow, point stations, channel profilers and buoy telemetry — the full PORTS-style station mix:
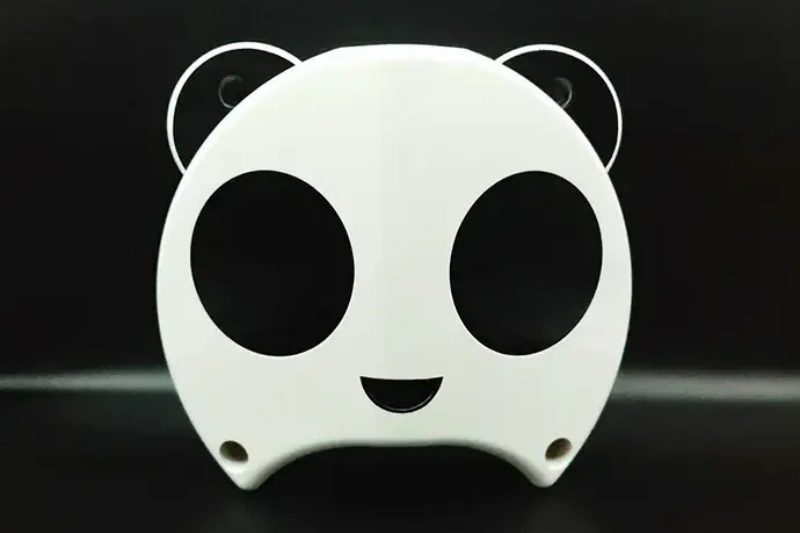
HADCP-600
Horizontal ADCP · 600 kHz- 90 m horizontal range
- ±20 m/s velocity range
- 20 m depth rating, wall/pier mount
- 2 horizontal beams + 1 vertical
Role: continuous cross-flow at constrictions, outputting the flood/slack/ebb stage pilots read.
View product →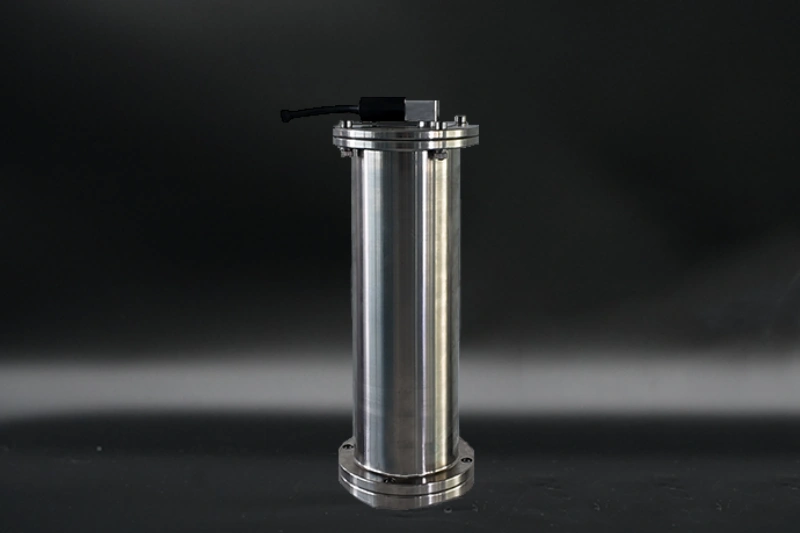
OCEAN-SPCM
Single-Point Current Meter- Single-point current records
- Low-power long deployments
- Array-friendly
Role: long-term point records at PORTS-style fixed positions, paired with level and water-quality sensors.
View product →
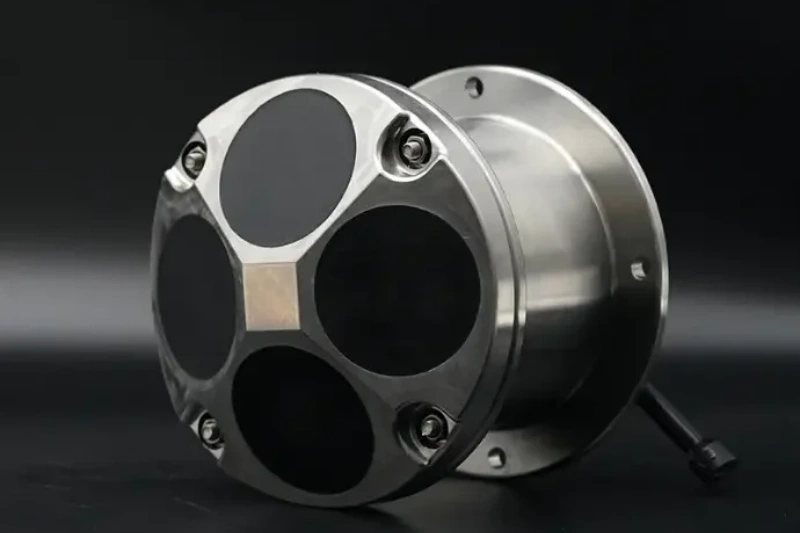
Ocean-ADCP-600-FA4
Ocean ADCP · 600 kHz- 70 m profiling range
- ±20 m/s, ±0.3% accuracy
- Titanium housing to 6000 m
- ≤10 W · self-contained ≥100 days
Role: bottom-mounted profiles in the 15 m shipping channels where the bay's traffic actually drafts.
View product →For the deep Golden Gate section, the Ocean-ADCP-600-PA5 (1.8 kg, ≤5 W, 6000 m housing) rides a buoy for telemetered profiles at the 110+ m entrance.
06 FIELD NOTES
- Do not let one instrument class cover both regimes — the 110 m Gate and the 15 m channels need different geometries; a single-frequency, single-geometry network under-measures one of the two.
- Output in the users' vocabulary — flood/slack/ebb staging is what pilots act on; a raw velocity series is what scientists read. A port network serves both, but the operational output must speak the mariner's language.
- Co-locate currents with levels — the bay's value comes from current stage with water level: the pair that decides under-keel clearance. Station design should treat them as one instrument.
- Build for the anomaly — the system's defining moments were the spill and the El Niño year; hardware and telemetry choices should assume the network's most important day is the one the tide tables got wrong.
🎯 Building a Real-Time Port Current Network?
Wall-mounted cross-flow, point stations, channel profilers and buoy telemetry — the full PORTS-style station mix.
🔍 Explore Ocean ADCP SeriesAlso see: HADCP-600 Horizontal ADCP · OCEAN-SPCM · Questions? Contact our technical team