I. Test Background
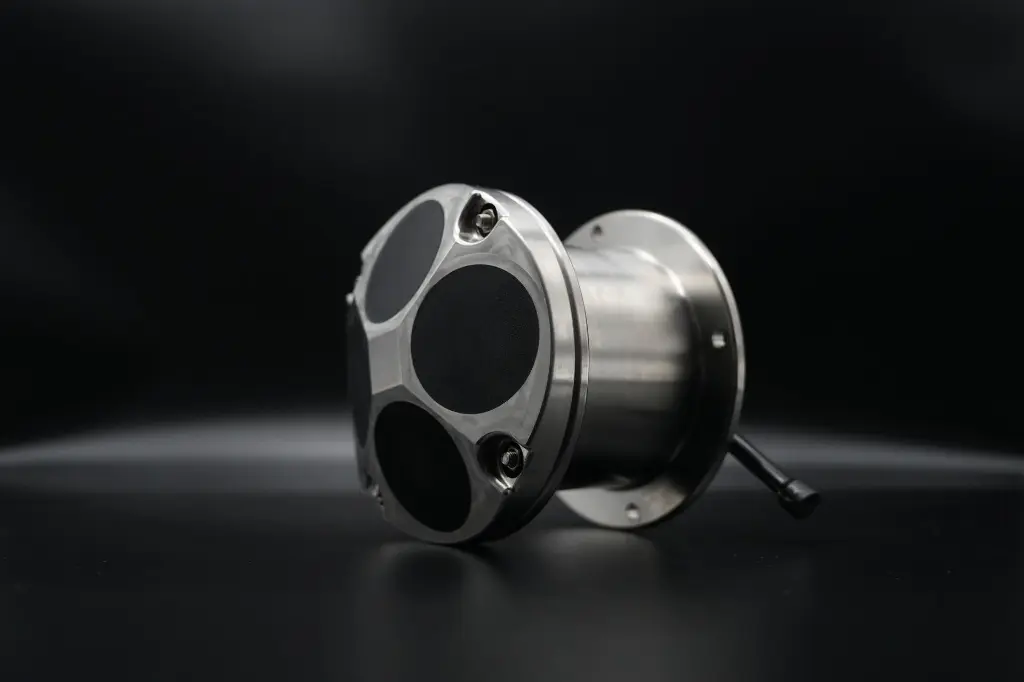
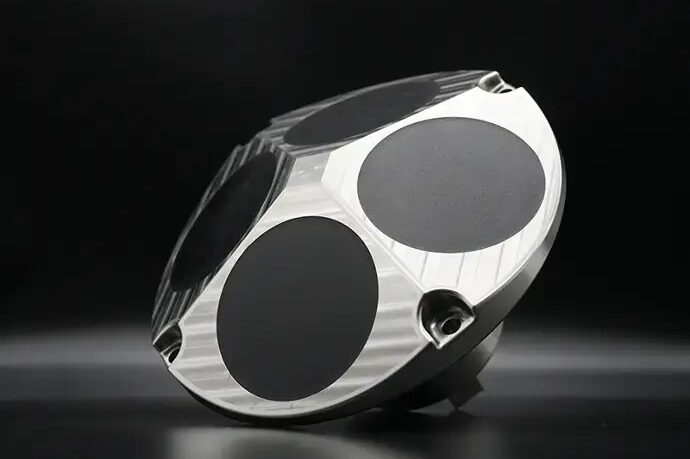
To verify the measurement performance and consistency of our ADCP (OCEAN-300K-1000) equipment, a two-day bottom-mounted test was conducted in the sea area of Dinghai District, Zhoushan City, Zhejiang Province.
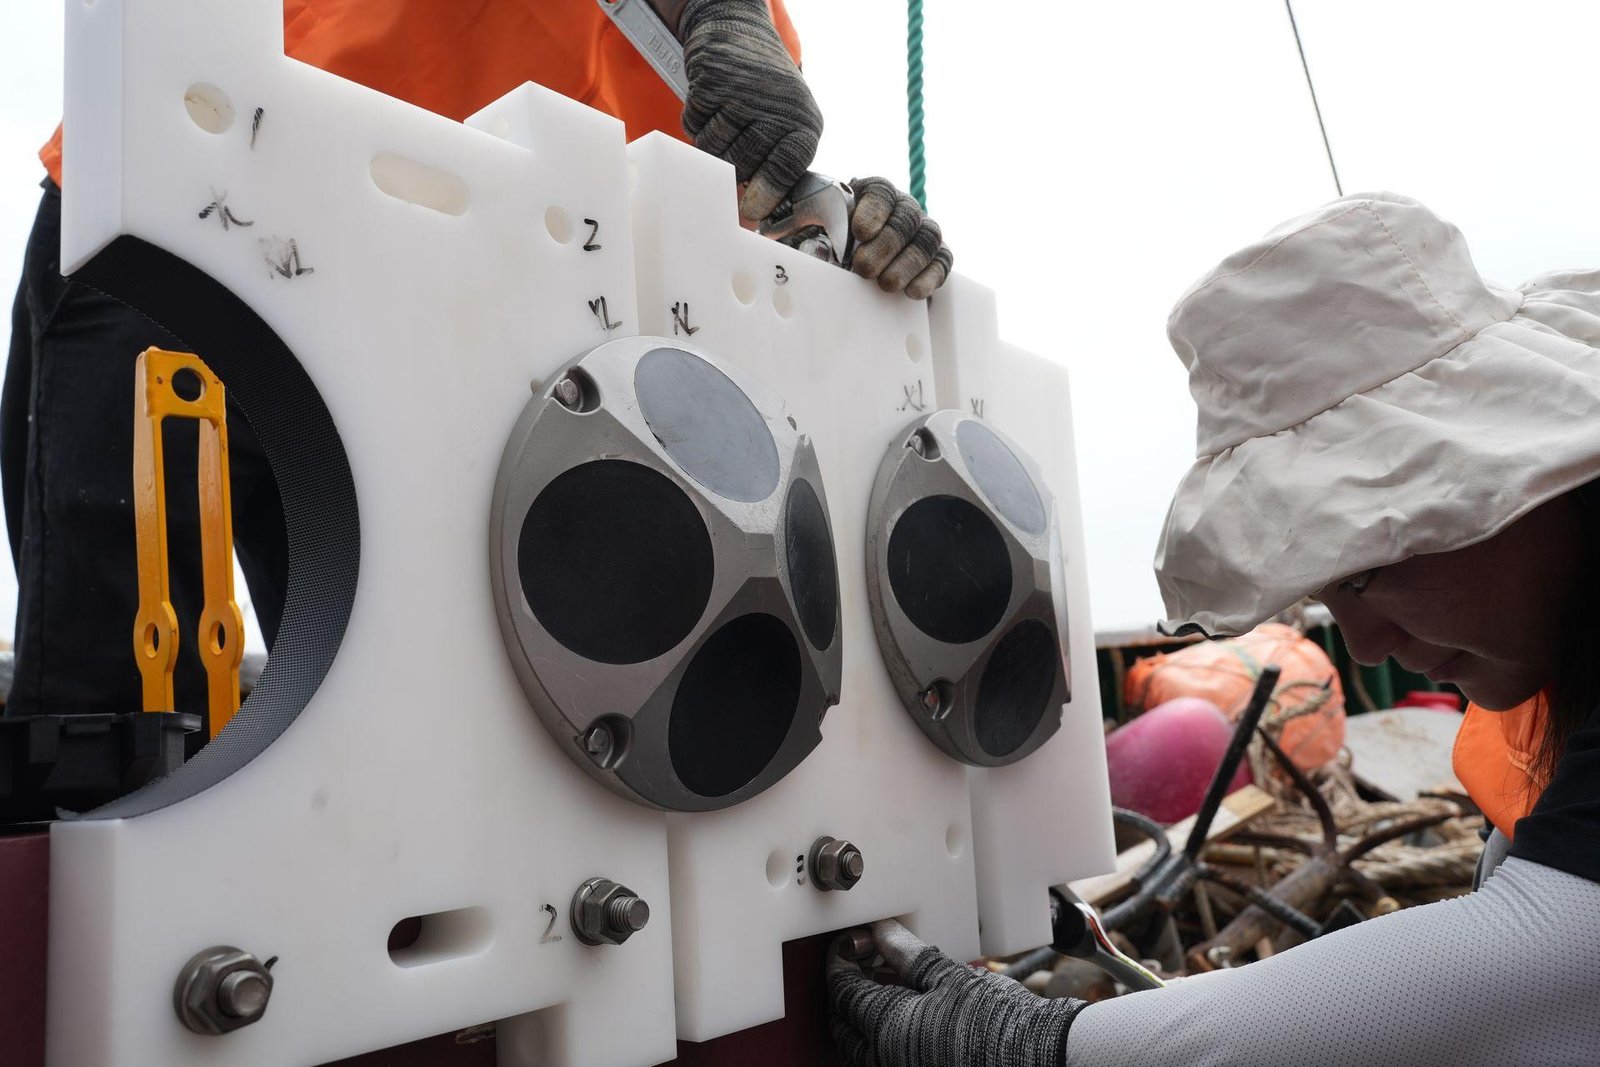
In this test, two OCEAN-300K-1000 units were simultaneously installed on the same seabed frame and deployed at a seabed depth of 50 to 60 meters. By collecting and analyzing the measured data of current velocity and direction in this sea area, the test aims to evaluate the measurement accuracy and consistency of the equipment in a real marine environment.
The focus of this test is to verify that the current measurement results of the equipment are consistent with the actual marine environment and that the measurement results of the two units are in good agreement, so as to ensure the accuracy and reliability of the equipment output.
II. Test Overview
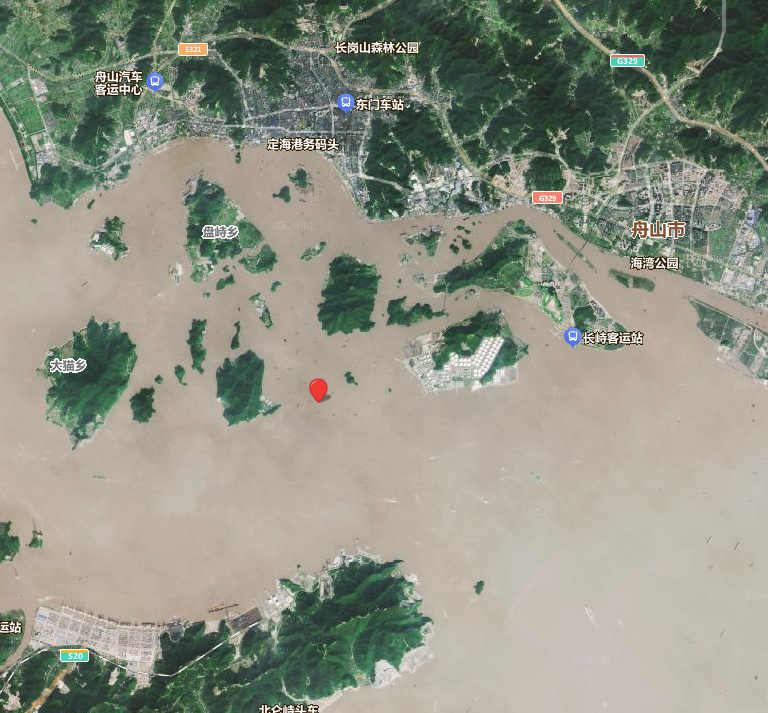
On September 3, 2024, the seabed frame equipped with two OCEAN-300K-1000 units was deployed in Dinghai District, Zhoushan City, Zhejiang Province (122°06’58.16393″E, 29°56’50.41142″N) at a water depth of 60 m.
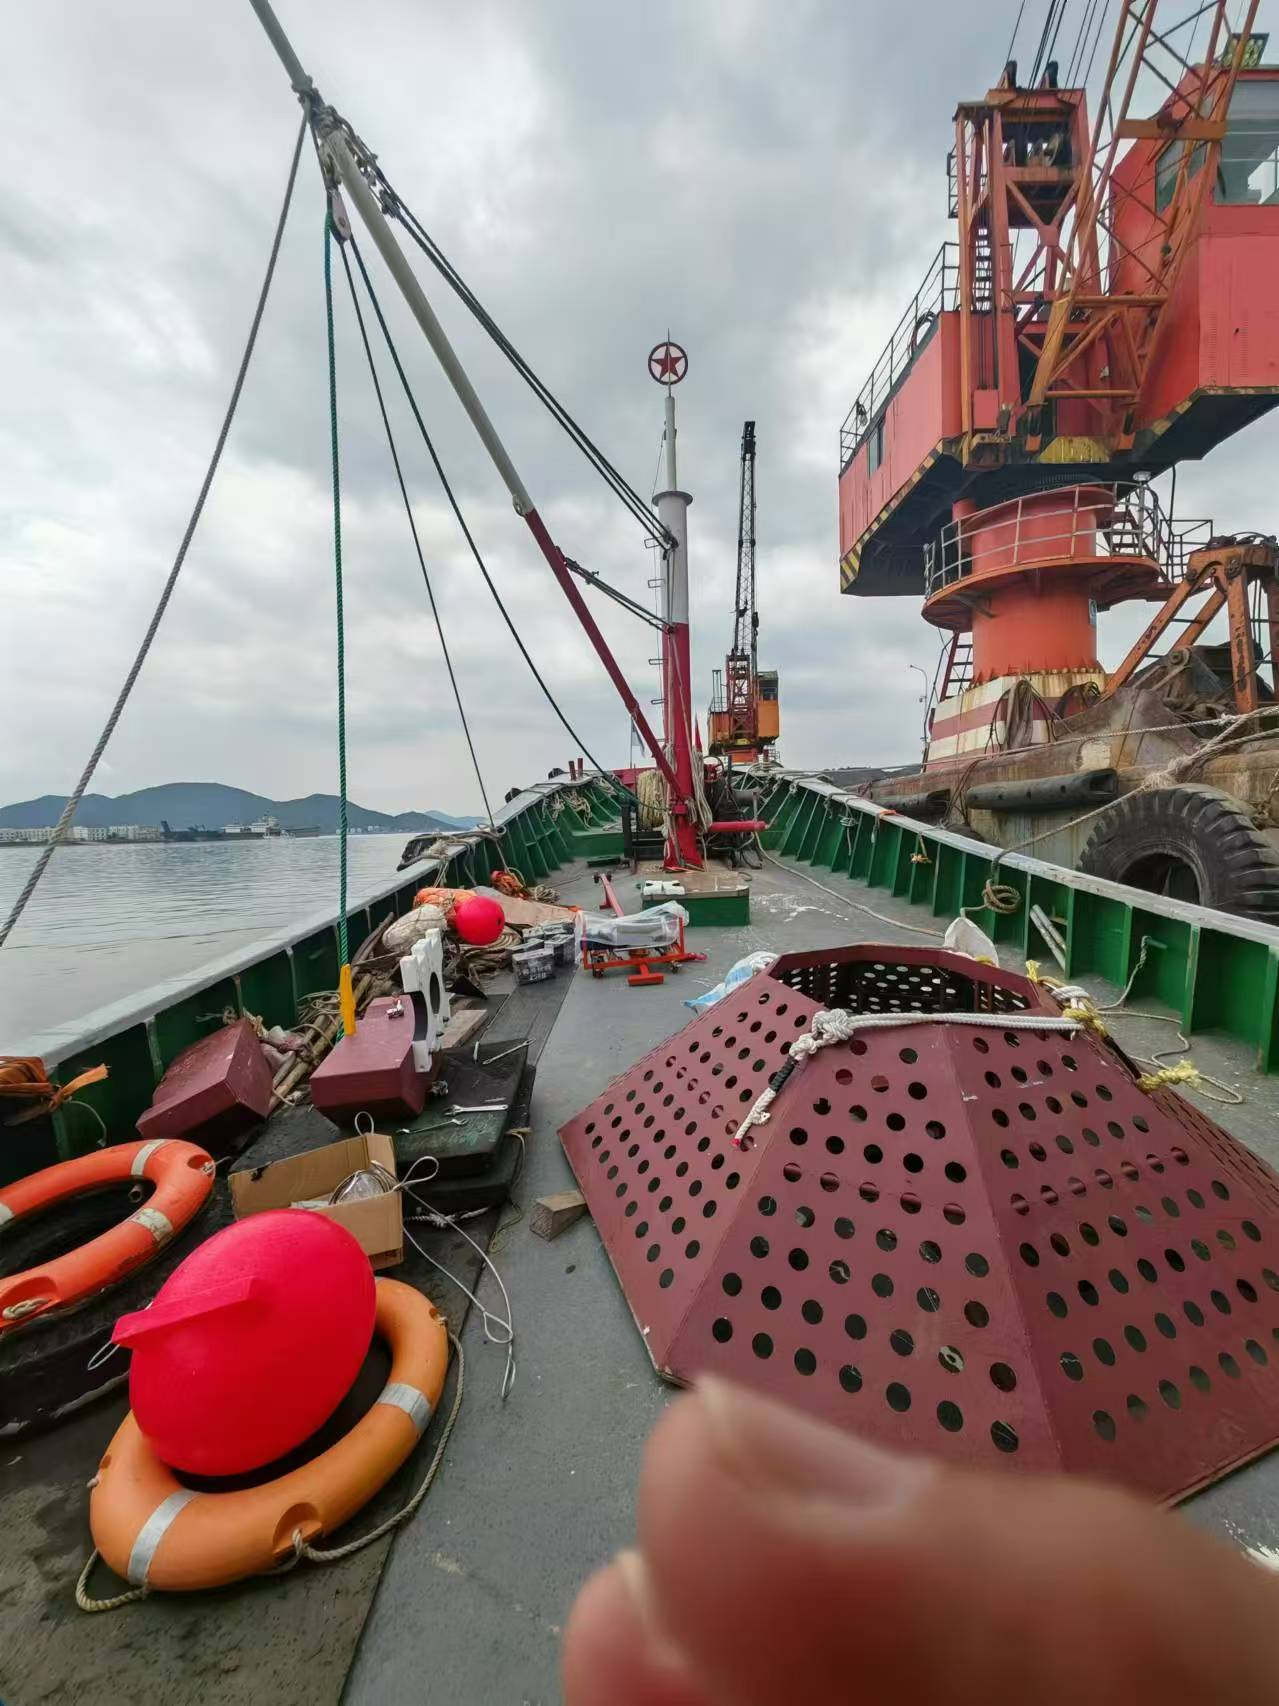
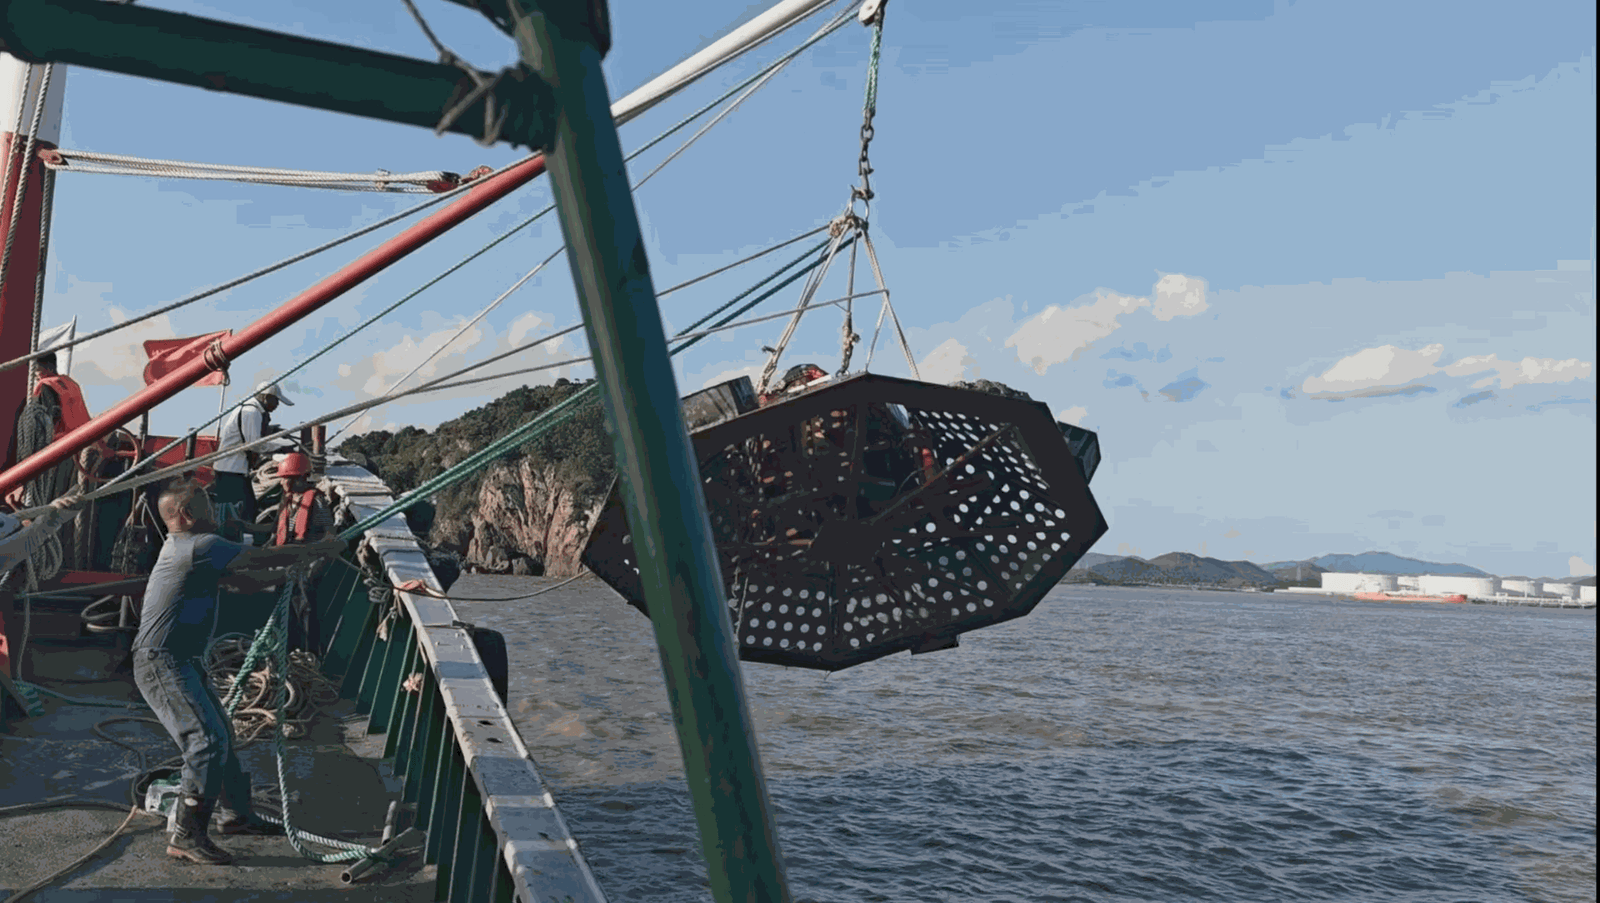
The two units started alternate measurements at 15:30, and the measurement was completed at 15:30 on September 5, 2024. Equipment recovery was finished at 17:00.
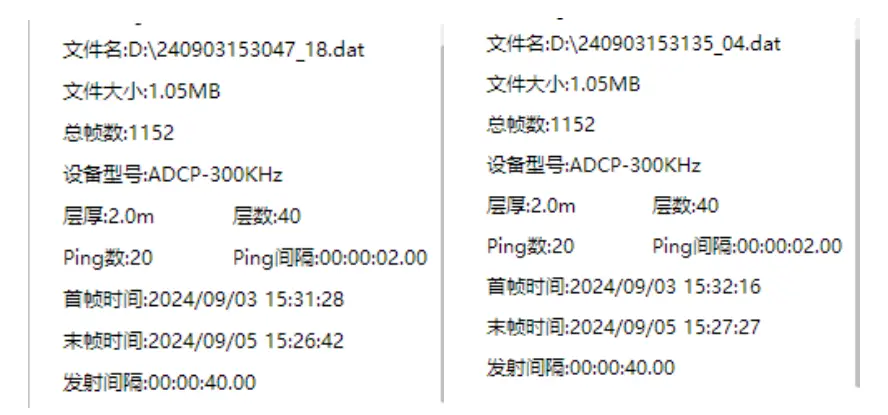
For both OCEAN-300K-1000 units, the cell size was set to 2 m, with 40 measurement layers and 20 valid layers (layers beyond layer 21 are above the water surface). The total number of valid measurement profiles is 1152.
Figure 2.1 Deployment Sea Area
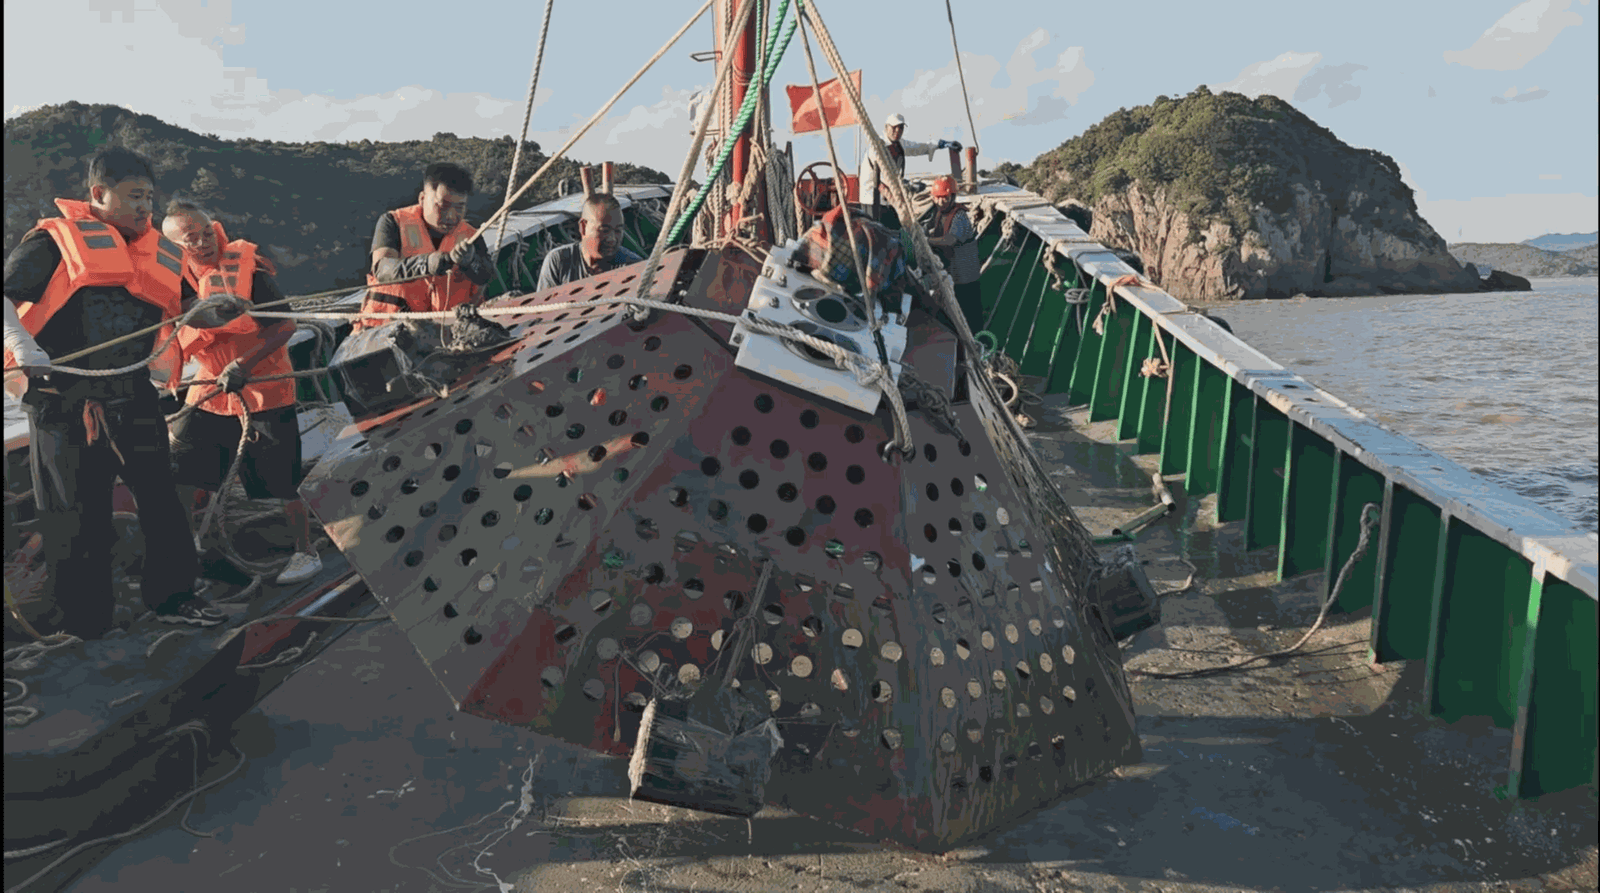
Figure 2.2 Equipment Deployment and Recovery Site
Figure 2.3 Overview of data from two devices
III. Data Analysis
Data analysis consists of two main parts: accuracy analysis and consistency analysis.
Accuracy Analysis: It aims to evaluate whether the parameters measured by the ADCP, such as current velocity and flow direction, are consistent with the actual environmental conditions. By comparing ADCP data with field measured values or known reference data, the reliability and precision of its measurement results can be determined.
Consistency Analysis: It is applied to compare the measurement results of two or multiple devices and assess the data consistency under the same conditions. Through comparing the output data of different devices, the performance consistency of each device in the same measurement environment is judged, so as to ensure data reliability.
Through the above two types of analysis, the accuracy of ADCP measurement data and the consistency between devices can be comprehensively evaluated, guaranteeing the scientificity and credibility of measurement results.
3.1 Accuracy Analysis
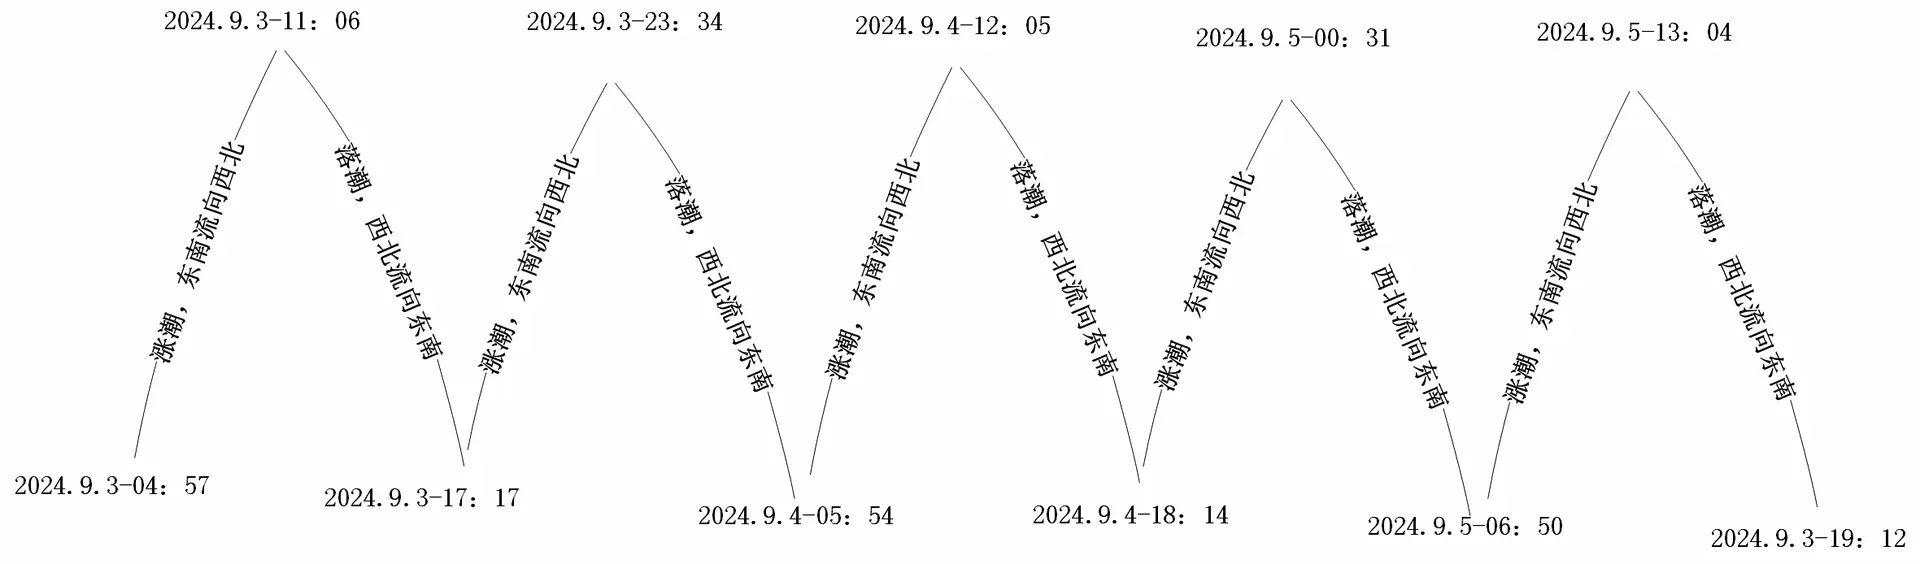
Dinghai District, Zhoushan City, Zhejiang Province, is located on the coast of the East China Sea with a typical marine climate. Affected by tides and ocean currents, the velocity and direction of ocean currents show obvious periodic and seasonal variations. The experimental sea area is mainly dominated by semi-diurnal tides, which means there are two high tides and two low tides every day.
Tidal currents experience drastic changes in velocity and direction during tidal fluctuations. During flood tides, seawater flows from the southeast to the northwest with rising water levels. During ebb tides, the current reverses to flow from the northwest to the southeast along with falling water levels. The velocity of tidal currents generally drops to the minimum at tidal turning points and reaches the peak value during tidal acceleration. Figure 3.1 illustrates the tidal conditions of the experimental sea area released by meteorological authorities during the test period.
Figure 3.1 Tidal conditions of the experimental sea area during the test
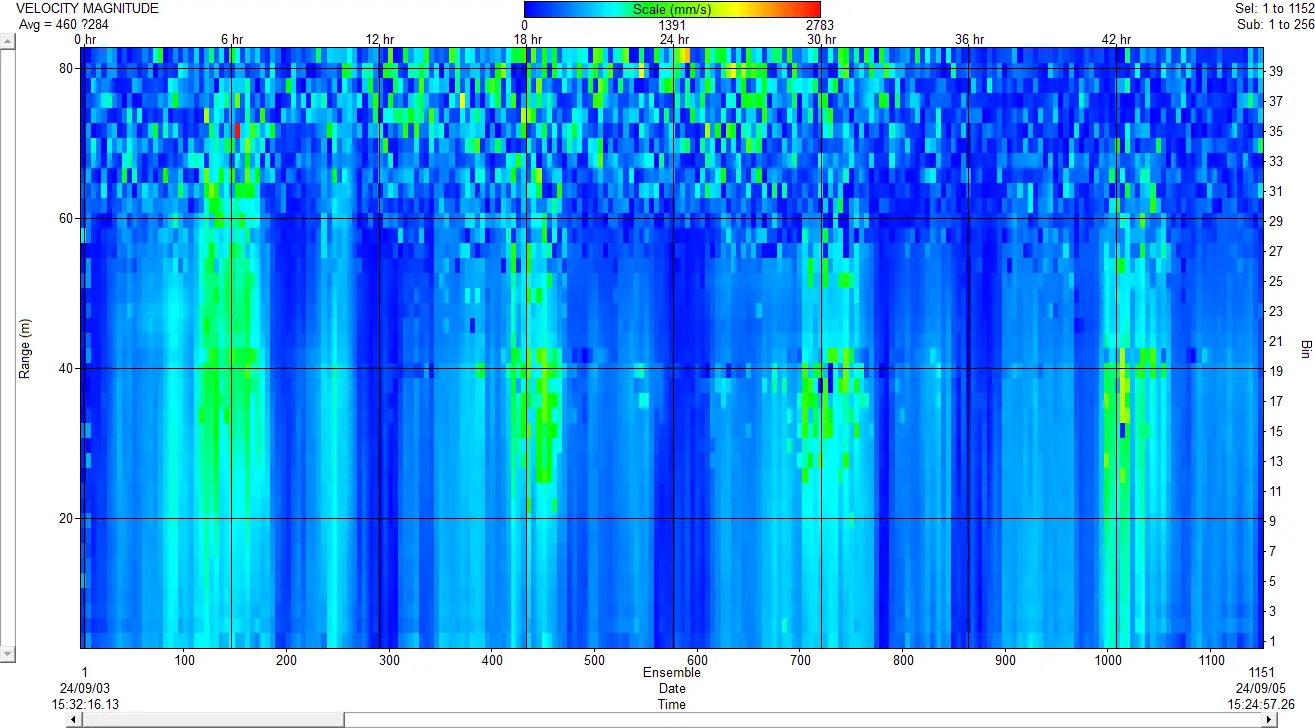
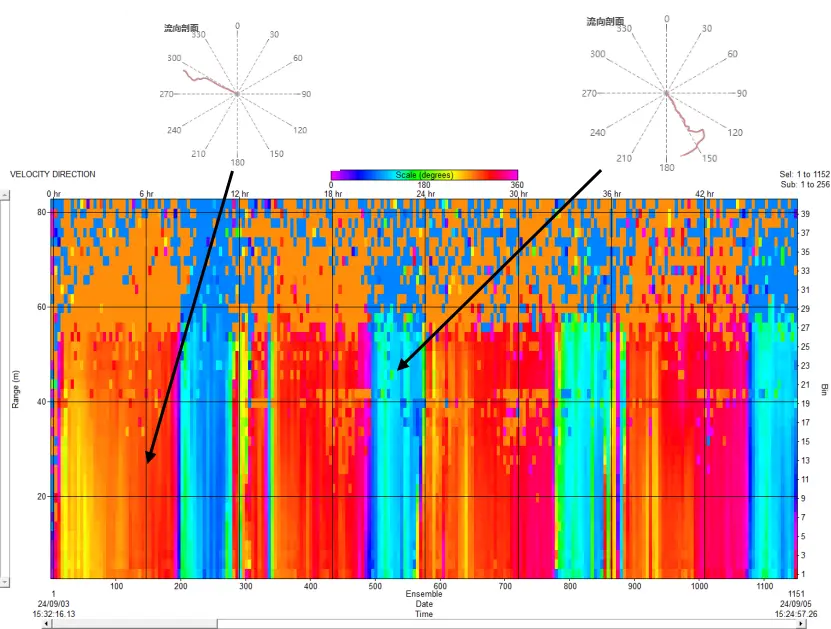
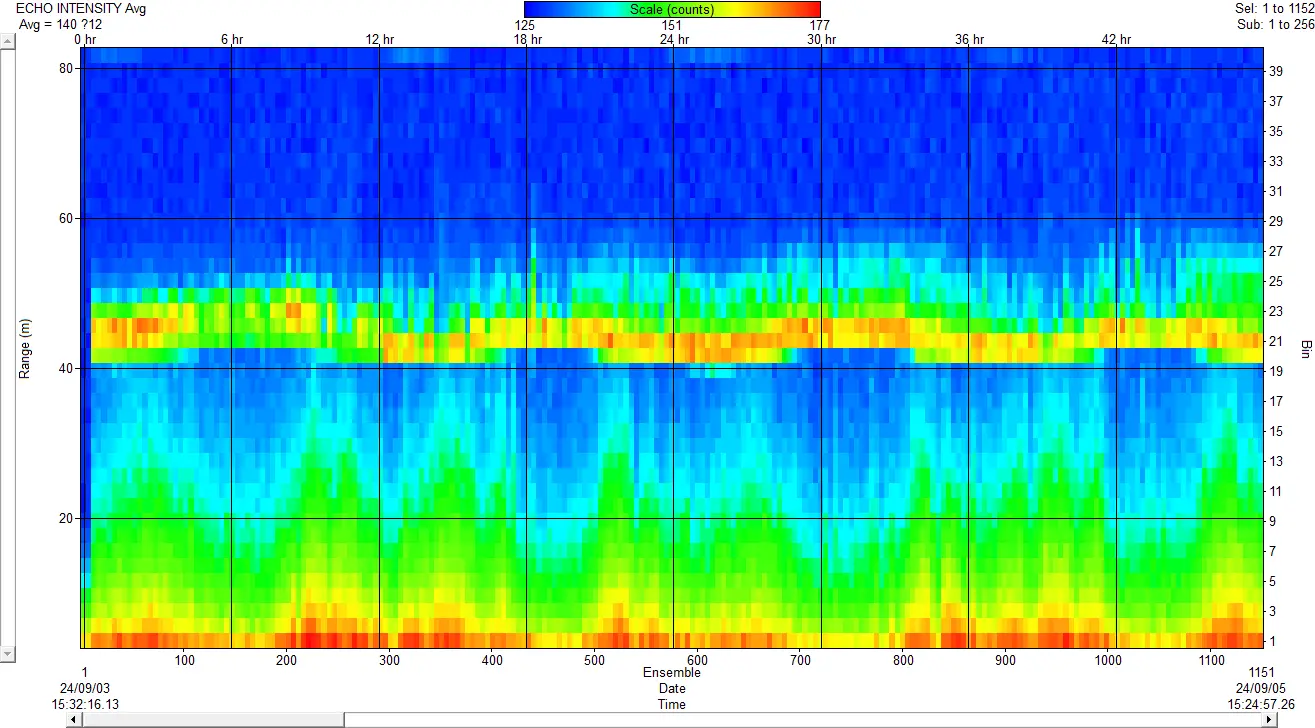
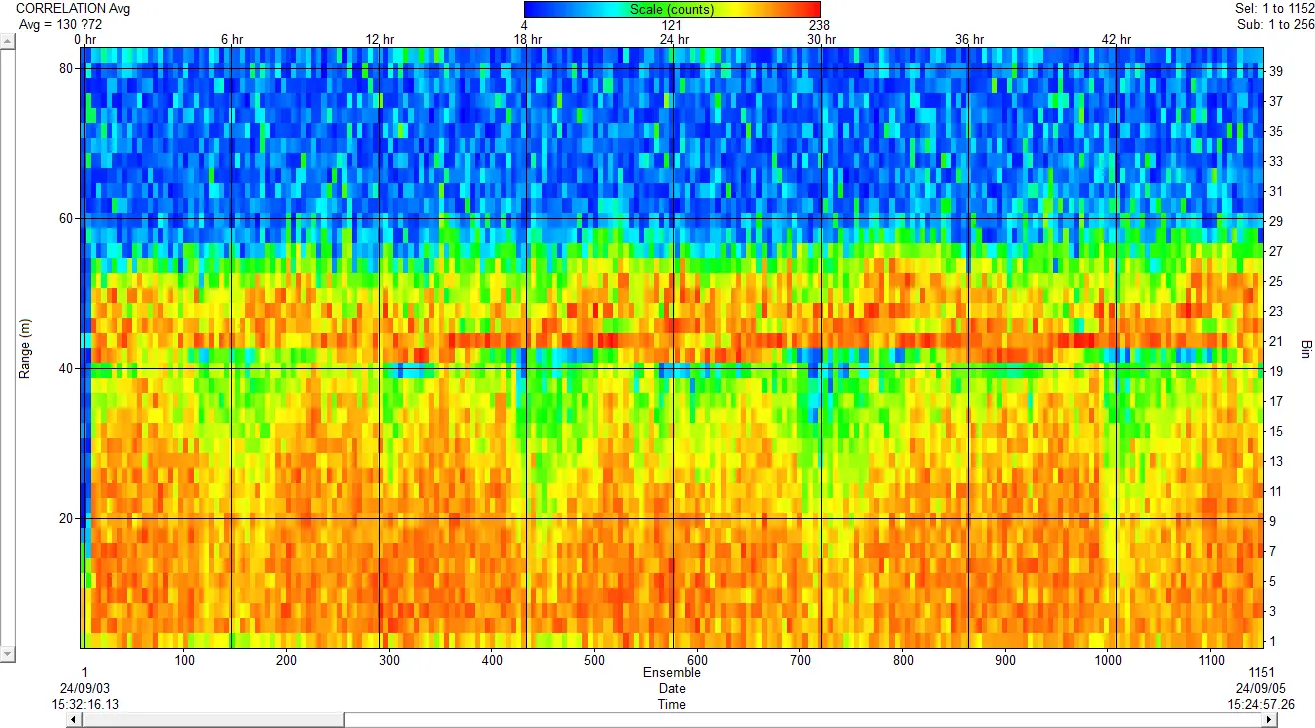
The ADCP data output adopts the standard PD0 protocol, which is fully compatible with TRDI devices. Figure 3.2 to Figure 3.5 are analyzed and generated by WinADCP software, showing the measurement results of current velocity, current direction, echo intensity and correlation coefficient respectively. It can be seen that the variations of measured water surface height, current velocity and current direction are consistent with the tidal changes in Figure 3.1. During the flood tide, the water level rises, as reflected by echo intensity, and the current flows from southeast to northwest; during the ebb tide, the water level drops, and the current flows from northwest to southeast.
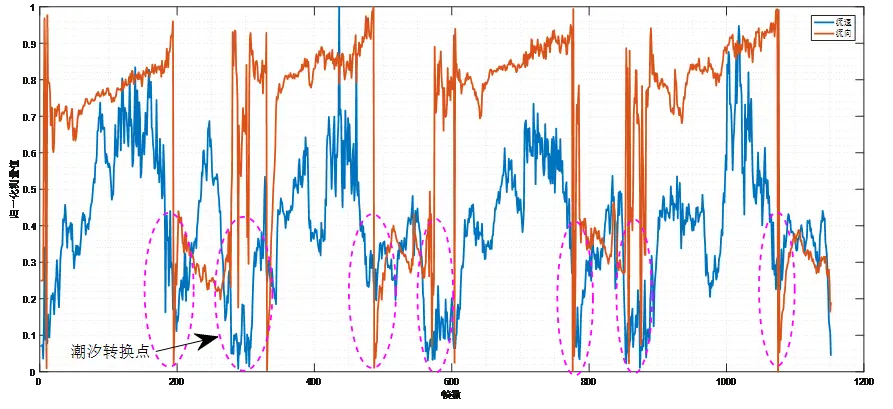
Figure 3.6 presents the synchronized display of normalized current velocity and current direction. It is observed that the current velocity decreases to the minimum value at the tidal transition stages (flood tide turning to ebb tide and ebb tide turning to flood tide), which is in good agreement with the actual situation.
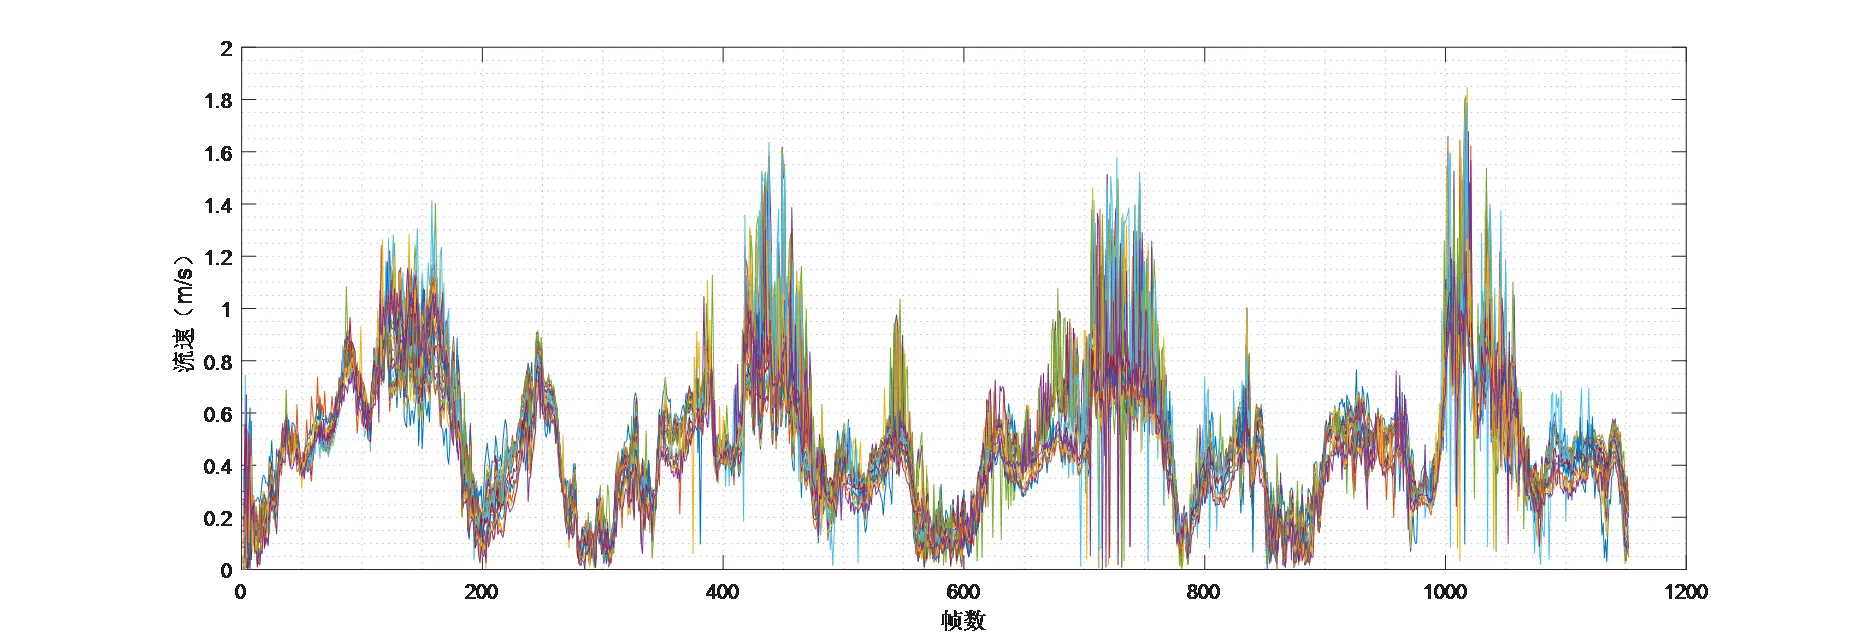
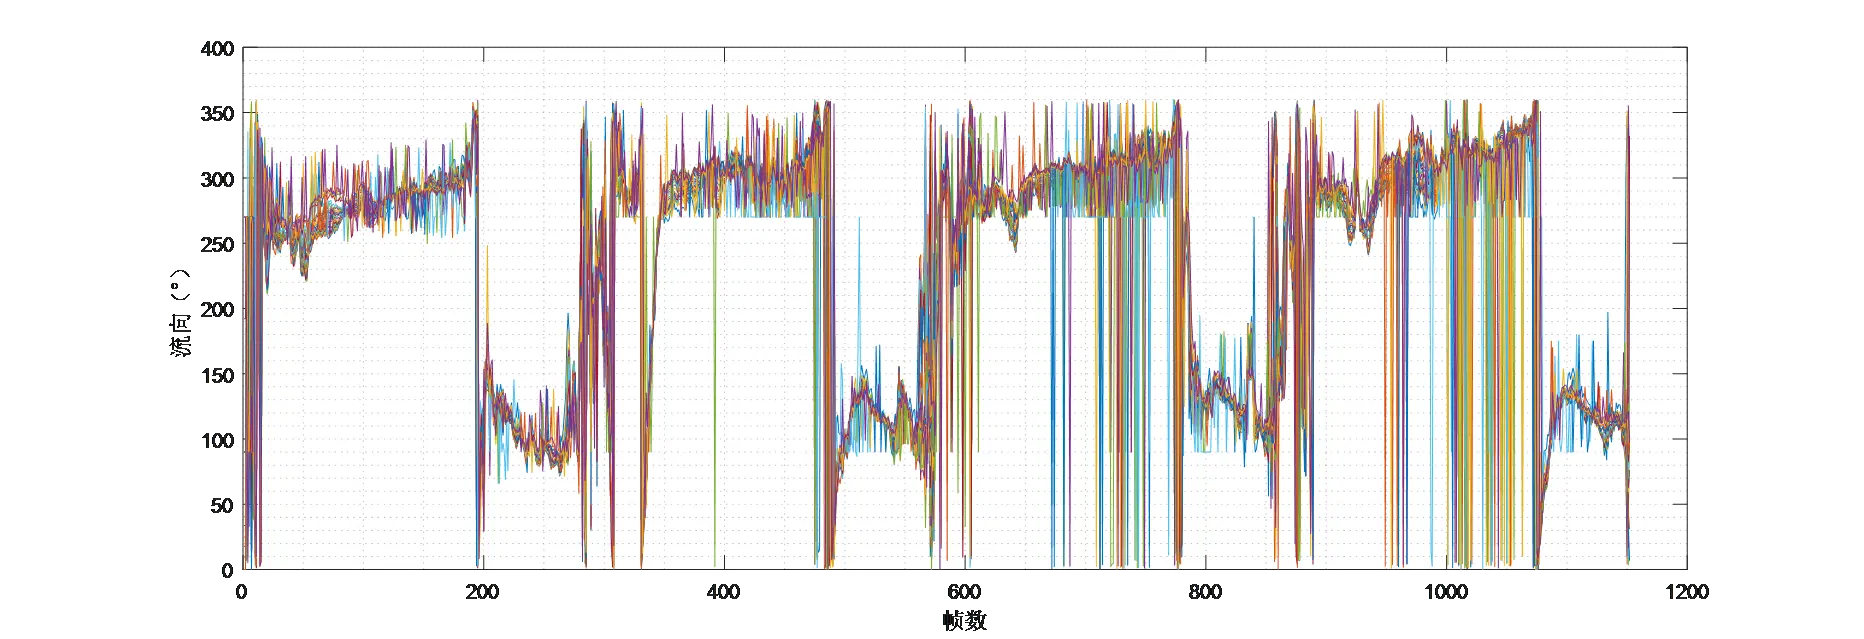
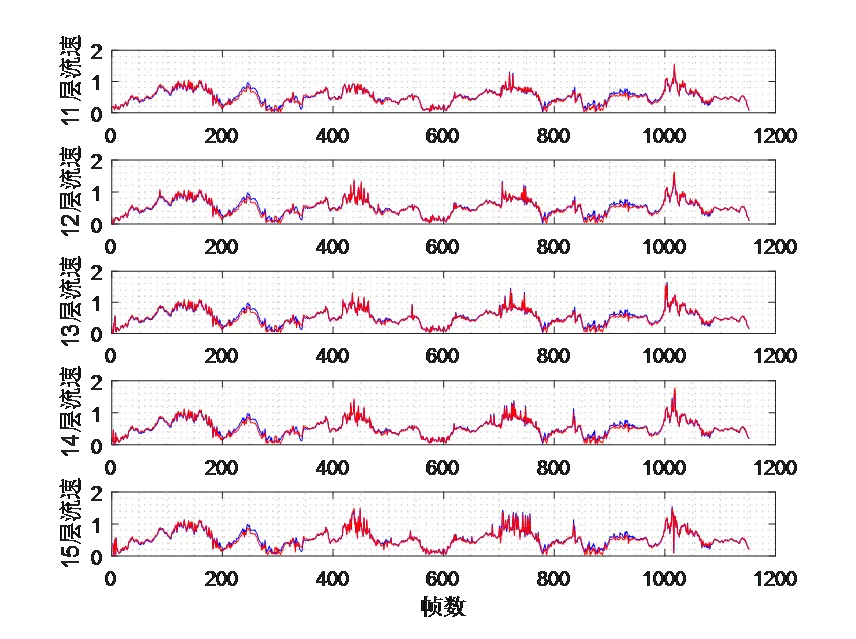
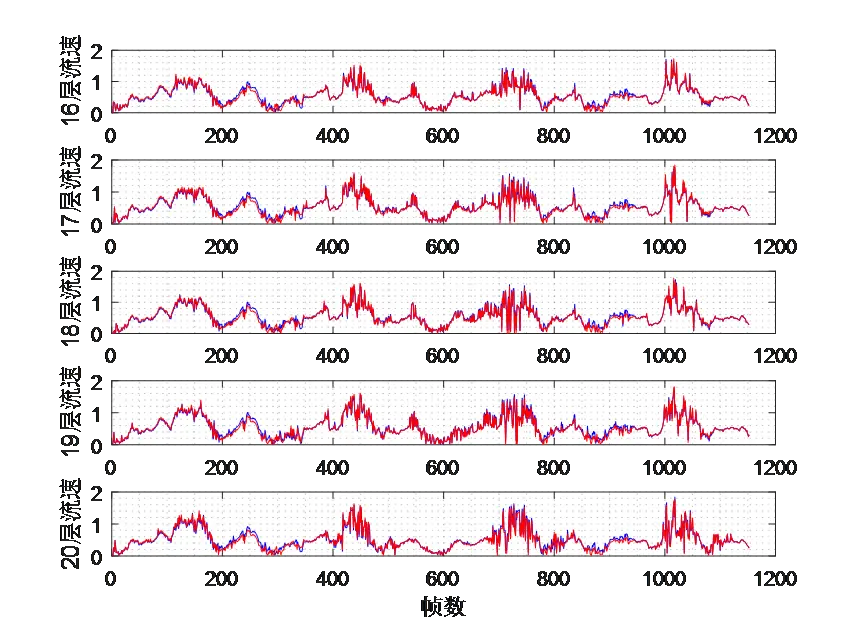
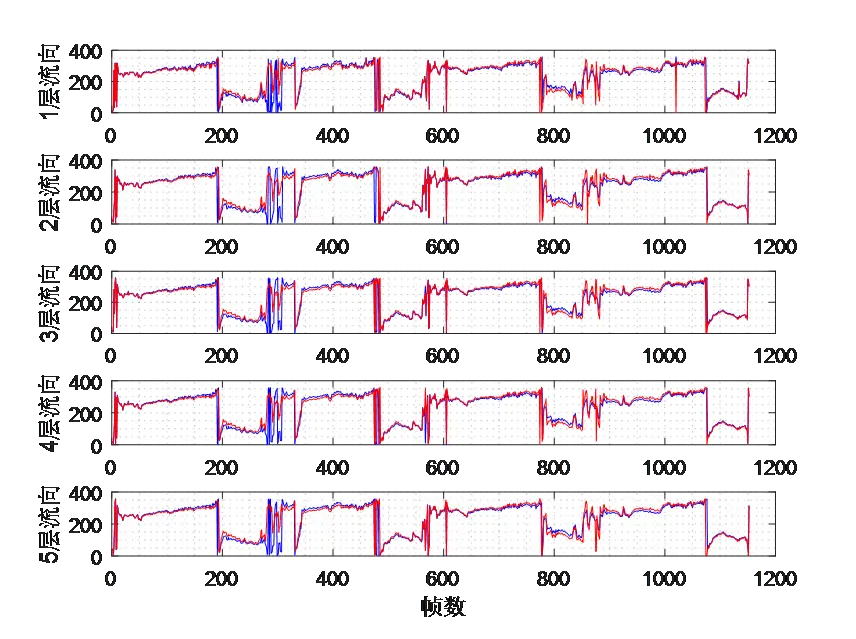
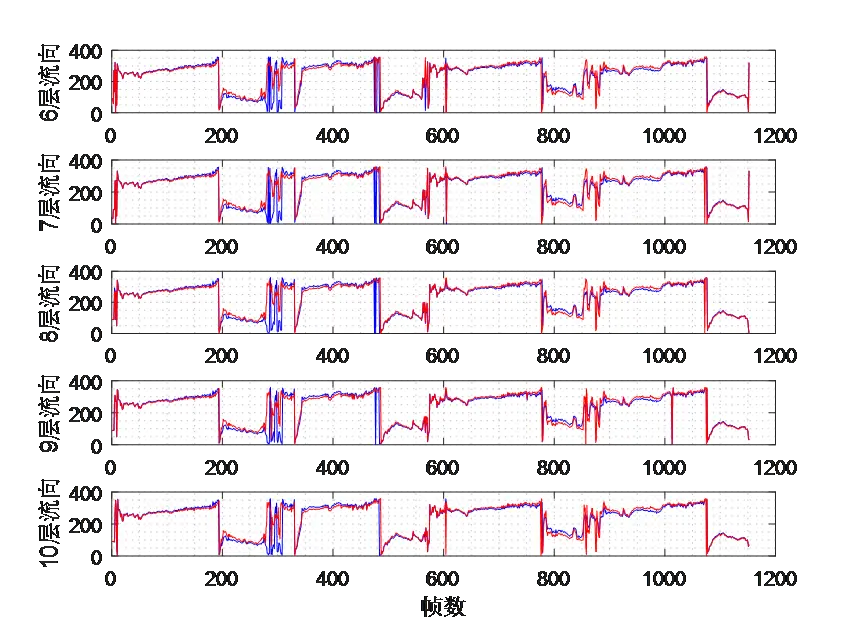
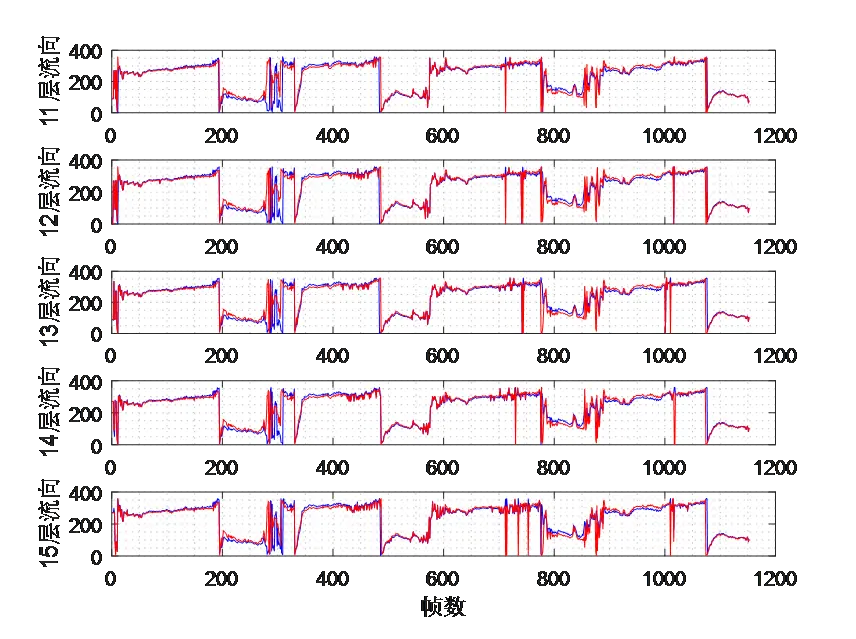
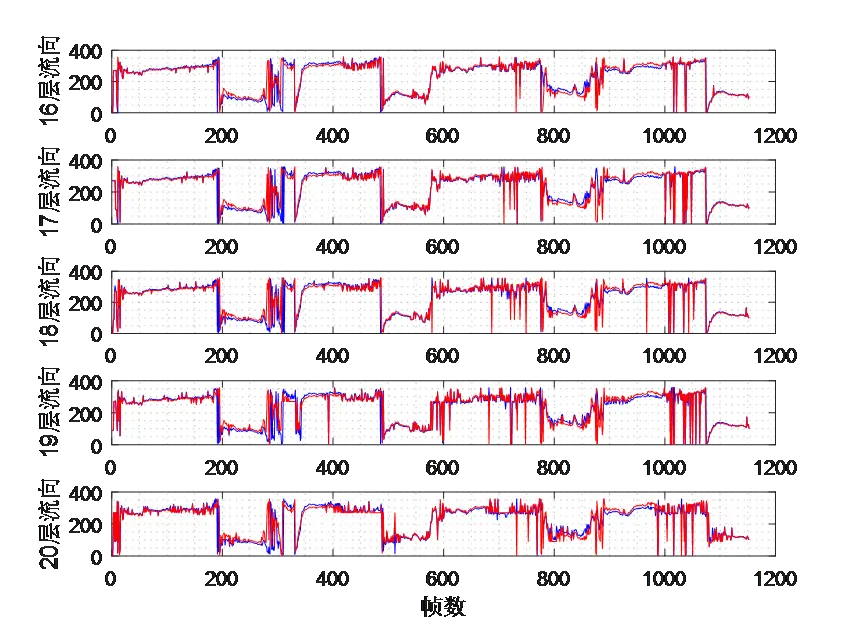
Figure 3.7 and Figure 3.8 compare the current velocity and current direction results of 20 layers within the effective measurement range. The figures indicate a high consistency of velocity and direction measurement results at different water depths.
Figure 3.2 Current Velocity Measurement Results of OCEAN-300K-1000m
Figure 3.3 Flow Direction Measurement Results of OCEAN-300K-1000m
Figure 3.4 Echo Intensity Measurement Results of OCEAN-300K-1000m
Figure 3.5 Echo Correlation Measurement Results of OCEAN-300K-1000
Figure 3.6 Relationship among Current Velocity, Flow Direction and Tides
Figure 3.7 Current Velocity Measurement Results at Different Depth Layers
Figure 3.8 Flow Direction Measurement Results at Different Depth Layers
Based on the above analysis, the ocean current measurement results of the OCEAN-300k-1000m are consistent with the actual conditions. It can accurately capture the temporal and vertical variation characteristics of ocean current parameters, including current velocity and flow direction.
3.2 Consistency Analysis
A comparative analysis of current velocity and flow direction data measured by two ADCPs at each depth layer was conducted to verify the measurement consistency between the two devices.
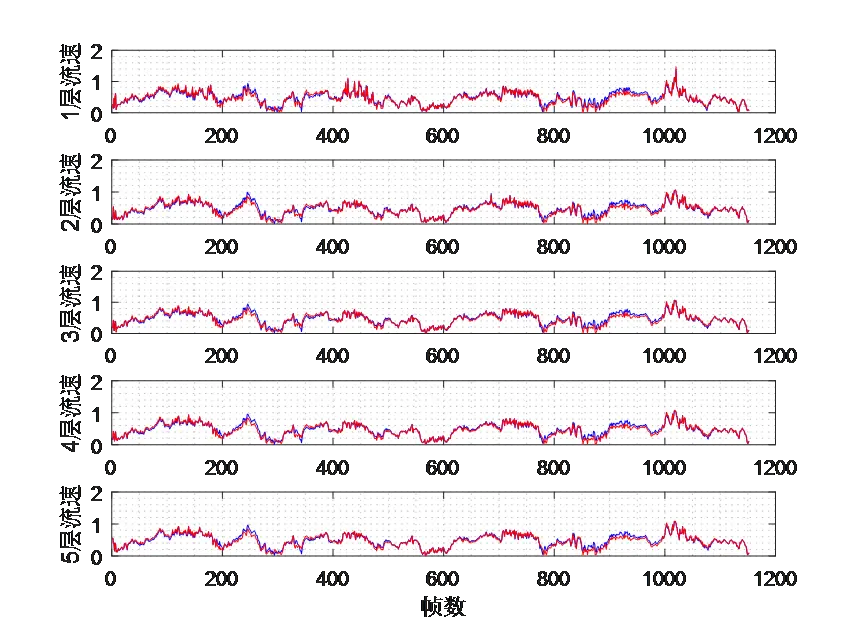
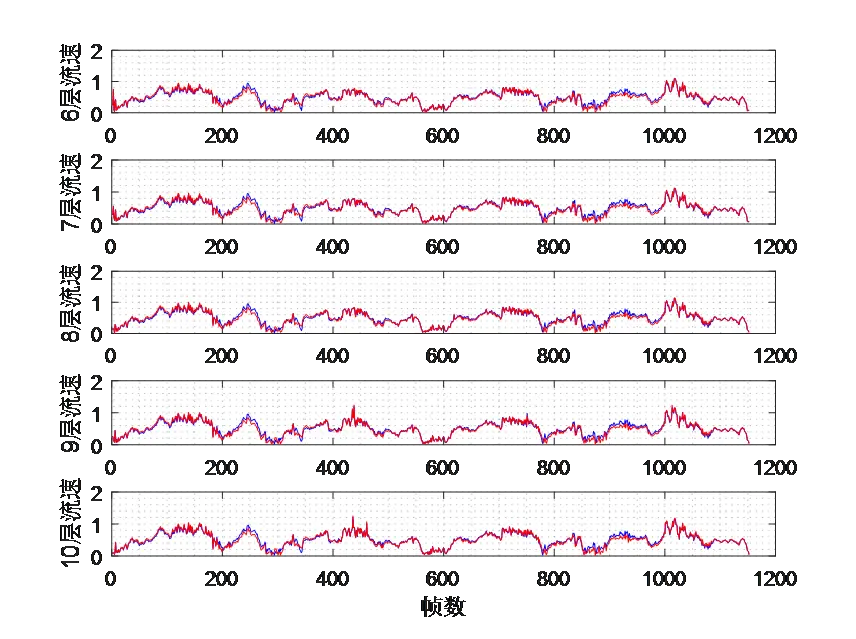
Figure 3.9 and Figure 3.10 respectively present the time-varying comparison results of current velocity and flow direction of the two ADCPs at different depth layers. The results show that the measurement data of the two instruments maintain a high degree of consistency throughout the test period, which indicates that the two ADCPs achieve basically equivalent performance under the same measurement environment.
Figure 3.9 Comparison of Current Velocity Changes with Time at Each Depth Layer for Two ADCPs
Figure 3.10 Comparison of flow direction changes with time at each depth layer of two ADCPs
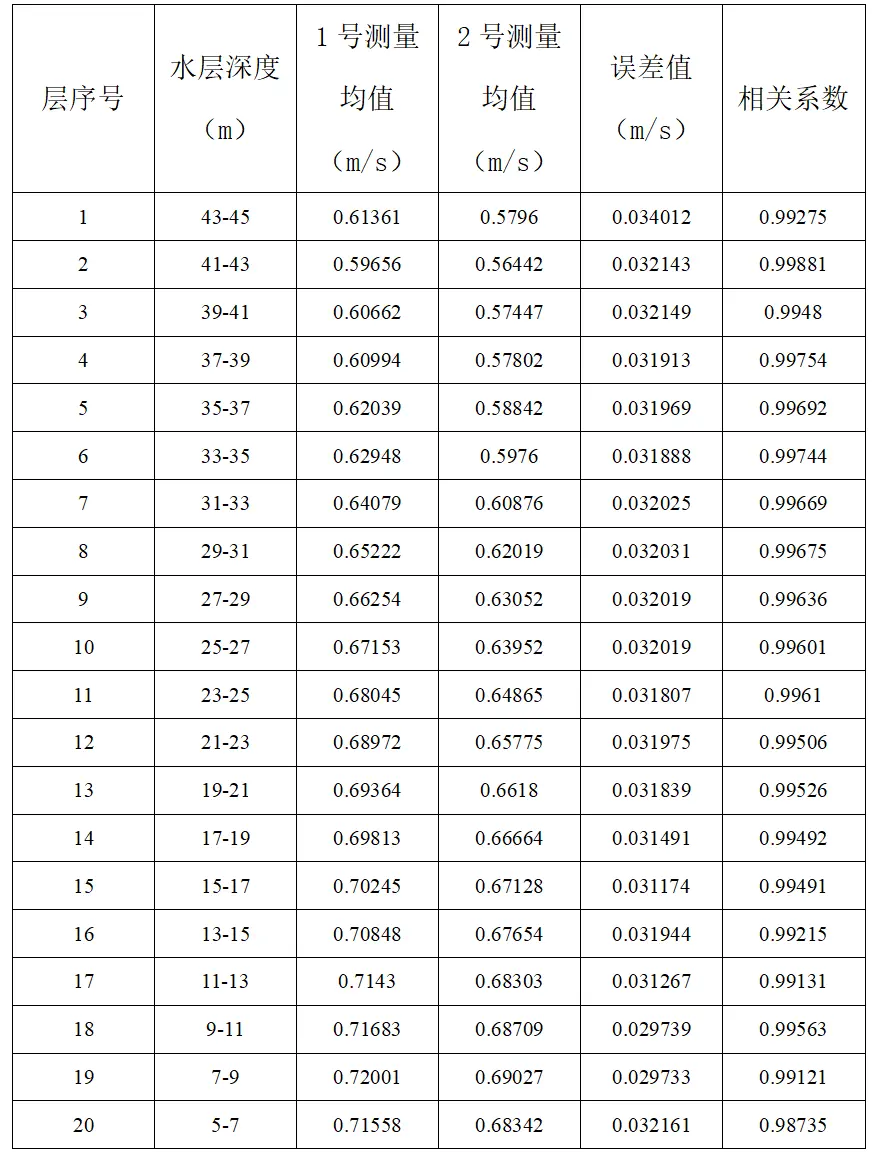
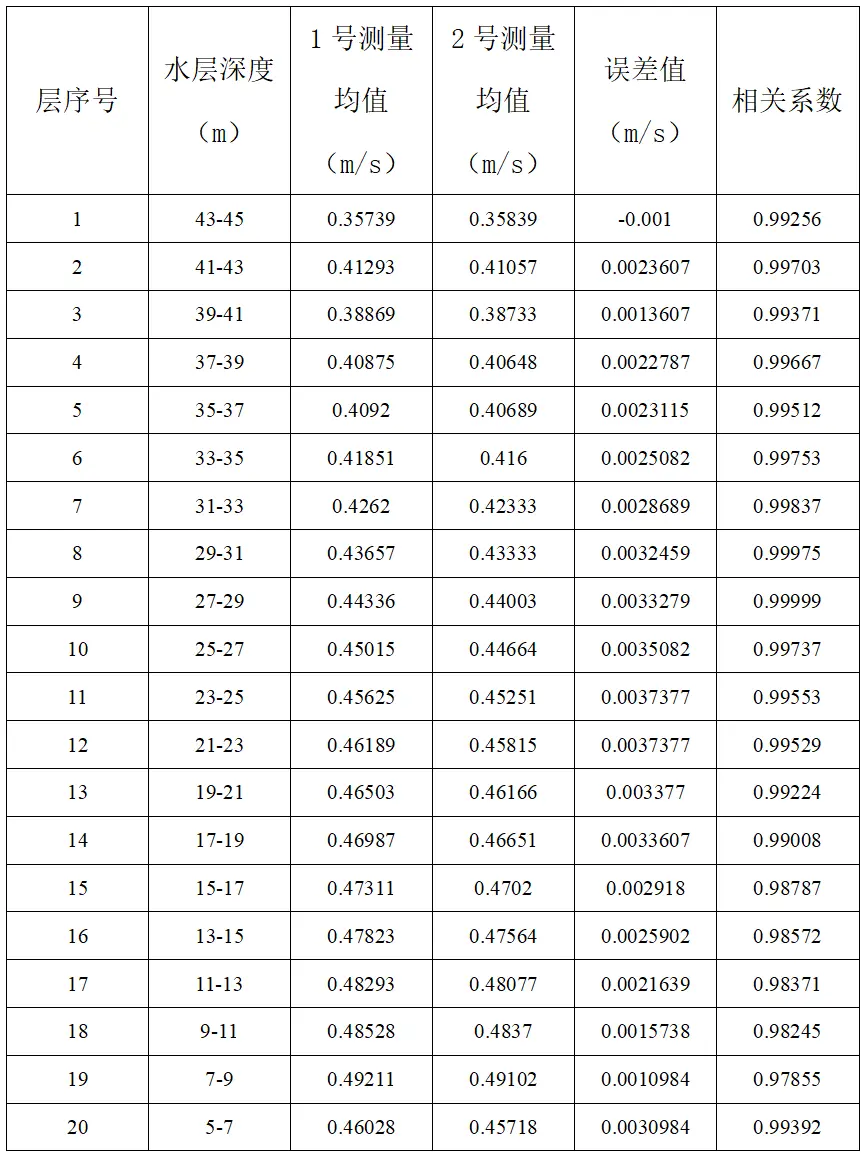
The consistency of current velocity measurement between the two devices was quantitatively evaluated by analyzing the current velocity error and correlation coefficient of each depth layer. Based on tidal variations, the velocity consistency during flood tide and ebb tide was compared and analyzed respectively, so as to finely assess the measurement consistency of the two ADCPs under different tidal conditions.
As shown in the analysis results in Table 3.1 and Table 3.2, the two devices present favorable consistency in both flood tide and ebb tide periods.
Table 3.1 Consistency Analysis Results during Flood Tide
Table 3.2 Consistency Analysis Results during Ebb Tide
To sum up, the two OCEAN-300K-1000m devices deliver favorable consistency in current velocity data when measuring simultaneously in the same sea area. Their measurement results are authentic and reliable, which fully verifies the stability and accuracy of the equipment.
4. Conclusions
In this test, two sets of our OCEAN-300K-1000m ADCPs successfully completed a two-day ocean current observation mission in the Dinghai sea area of Zhoushan. Data analysis indicates that the equipment can accurately measure key ocean current parameters including current velocity and flow direction, and effectively reveal their variation laws with time and water depth.
The measured results are highly consistent with actual marine conditions, and the data obtained from the two devices present excellent mutual consistency. It is demonstrated that the OCEAN-300K-1000m features outstanding current measurement performance with credible and stable output data, fully meeting the technical requirements for marine current field observation.