I. Test Background
The Doppler Velocity Log (DVL) is an instrument that measures velocity and calculates distance by utilizing the Doppler effect of underwater acoustic waves. With the development of science and technology and the increasing emphasis on marine development, the Doppler Velocity Log has been increasingly widely applied. The research and development of higher-performance and more miniaturized Doppler Velocity Logs have attracted great attention from countries around the world.
The performance of the DVL-600 series Doppler Velocity Logs independently developed and manufactured by our company is comparable to that of the same series products from TRDI, and can achieve domestic substitution. To verify the performance of our DVL-600 series products, a lake trial is specially carried out. By comparing with the high-precision GPS track, the high performance of this product is verified. Meanwhile, through the analysis and research of the lake trial data, data support is provided for further improving the velocity measurement and distance calculation performance of the equipment.
II. Test Overview
2.1 Test Objectives
This test mainly verifies three capabilities of the DVL-600K:
(1) The ability to stably track the complex seabed (lake bottom);
(2) The ability to measure velocity stably and accurately;
(3) The ability to calculate distance accurately.
By comparison with GPS, a distance error of less than 0.3% meets the design requirements.
2.2 Test Date
From November 22, 2022 to November 26, 2022, lasting 5 days.
2.3 Test Location
Central Wharf, Qiandao Lake Town, Chun’an County, Hangzhou.
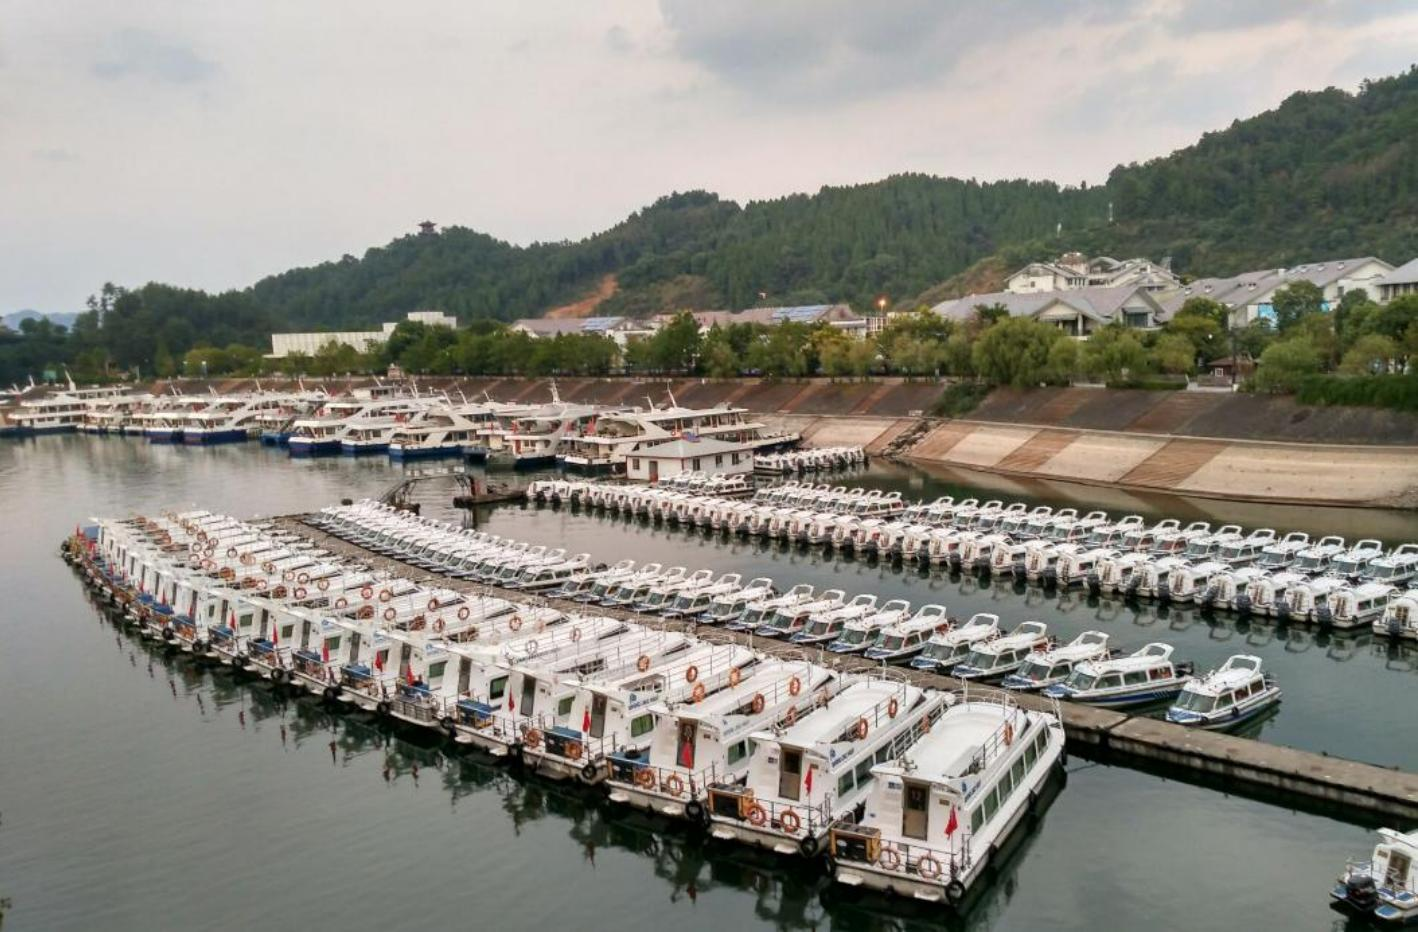
Figure 2.1 Central Wharf, Qiandao Lake
2.4 Test Equipment:
2 sets of DVL-600K equipment;
1 set of GPS;
2 sets of lithium batteries.
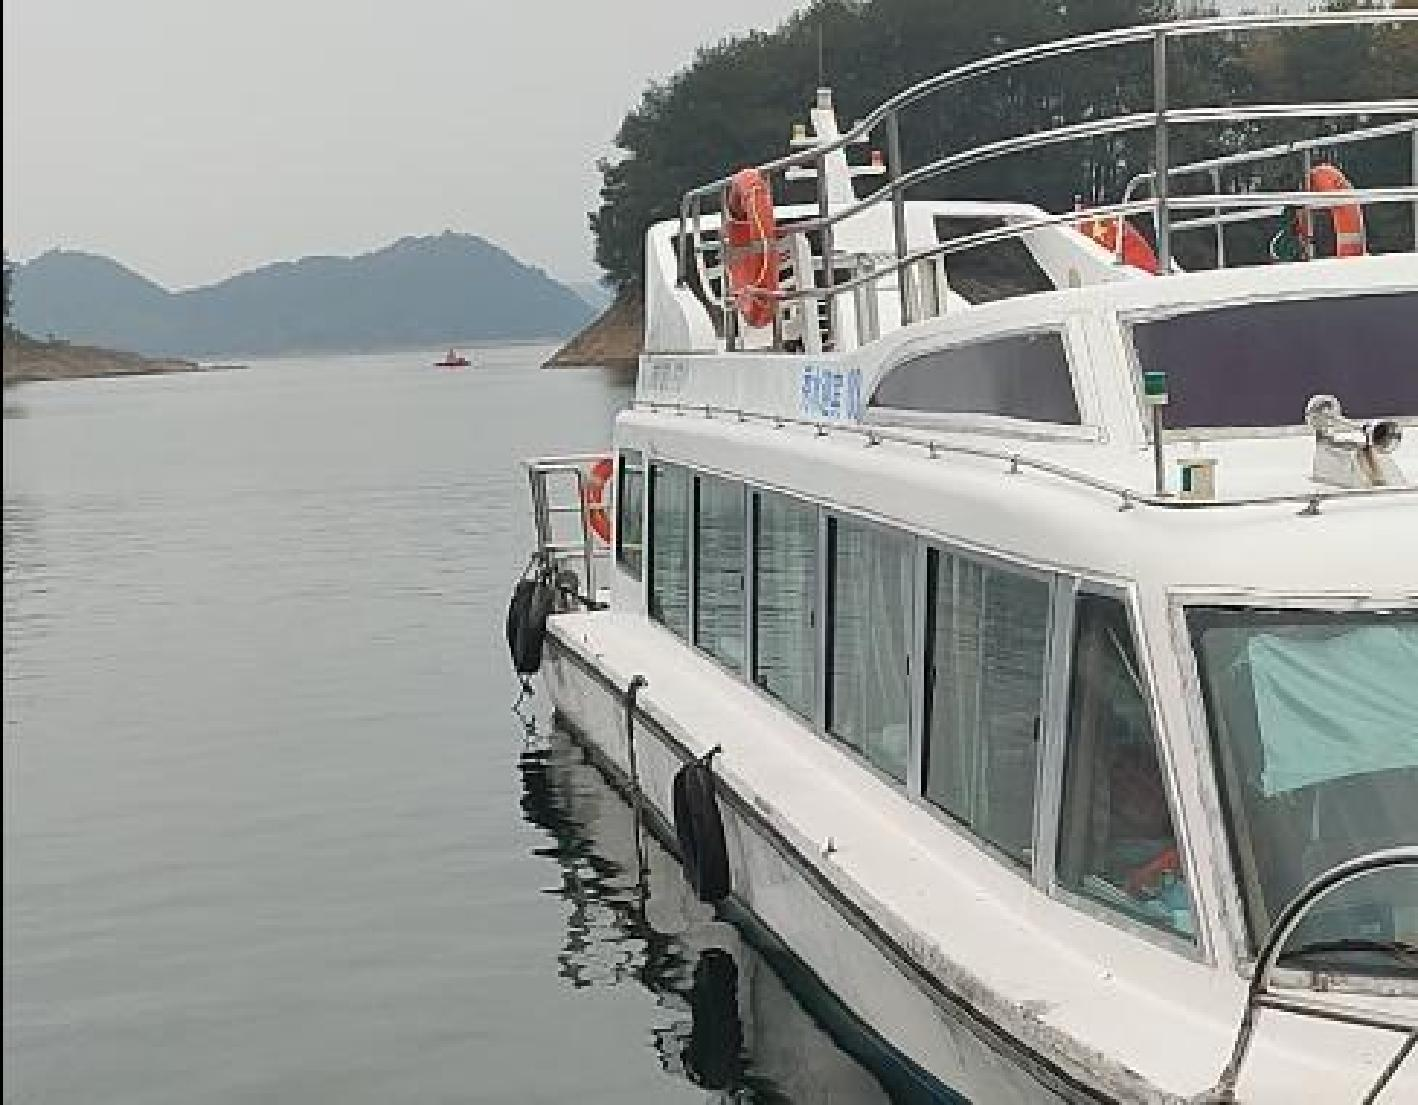
2.5 Test Platform:
A certain type of cruise ship on Qiandao Lake.
III. Test Contents
This test mainly verifies the performance of the DVL-600K equipment in bottom tracking, velocity measurement and distance calculation.
3.1 Preparation Stage
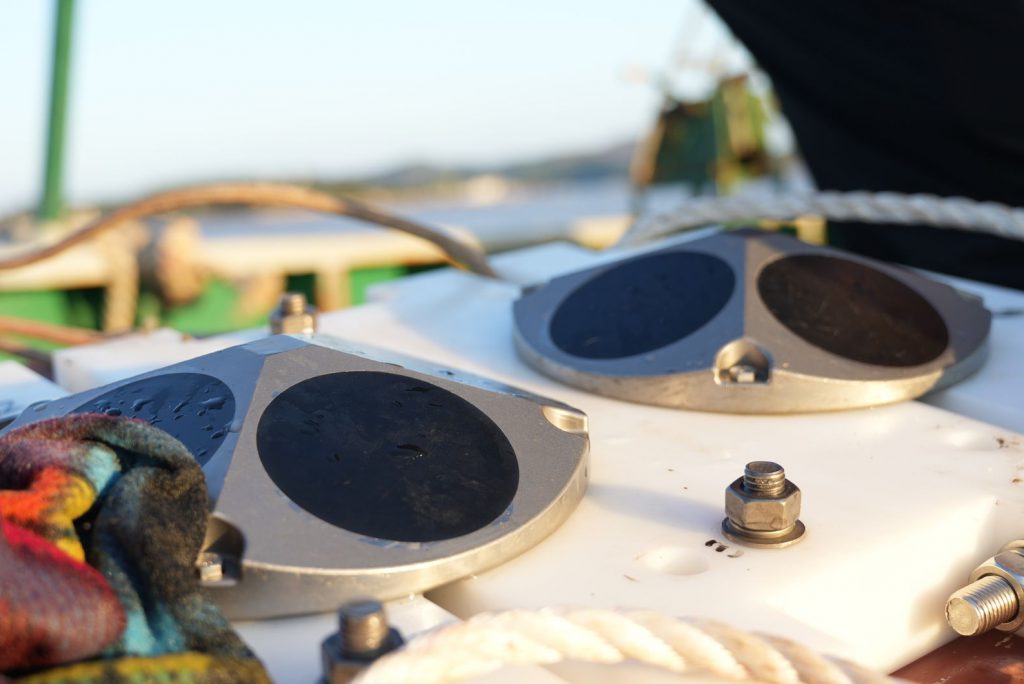
The DVL equipment is fixed to the hull. A customized mounting bracket is installed at the bow, which can hold up to 4 DVL units on both ends.
One end of the power and communication cable is connected to the equipment, and the other end passes through the hollow part of the bracket, then placed inside the cabin to connect to the computer serial port and the lithium battery for control.
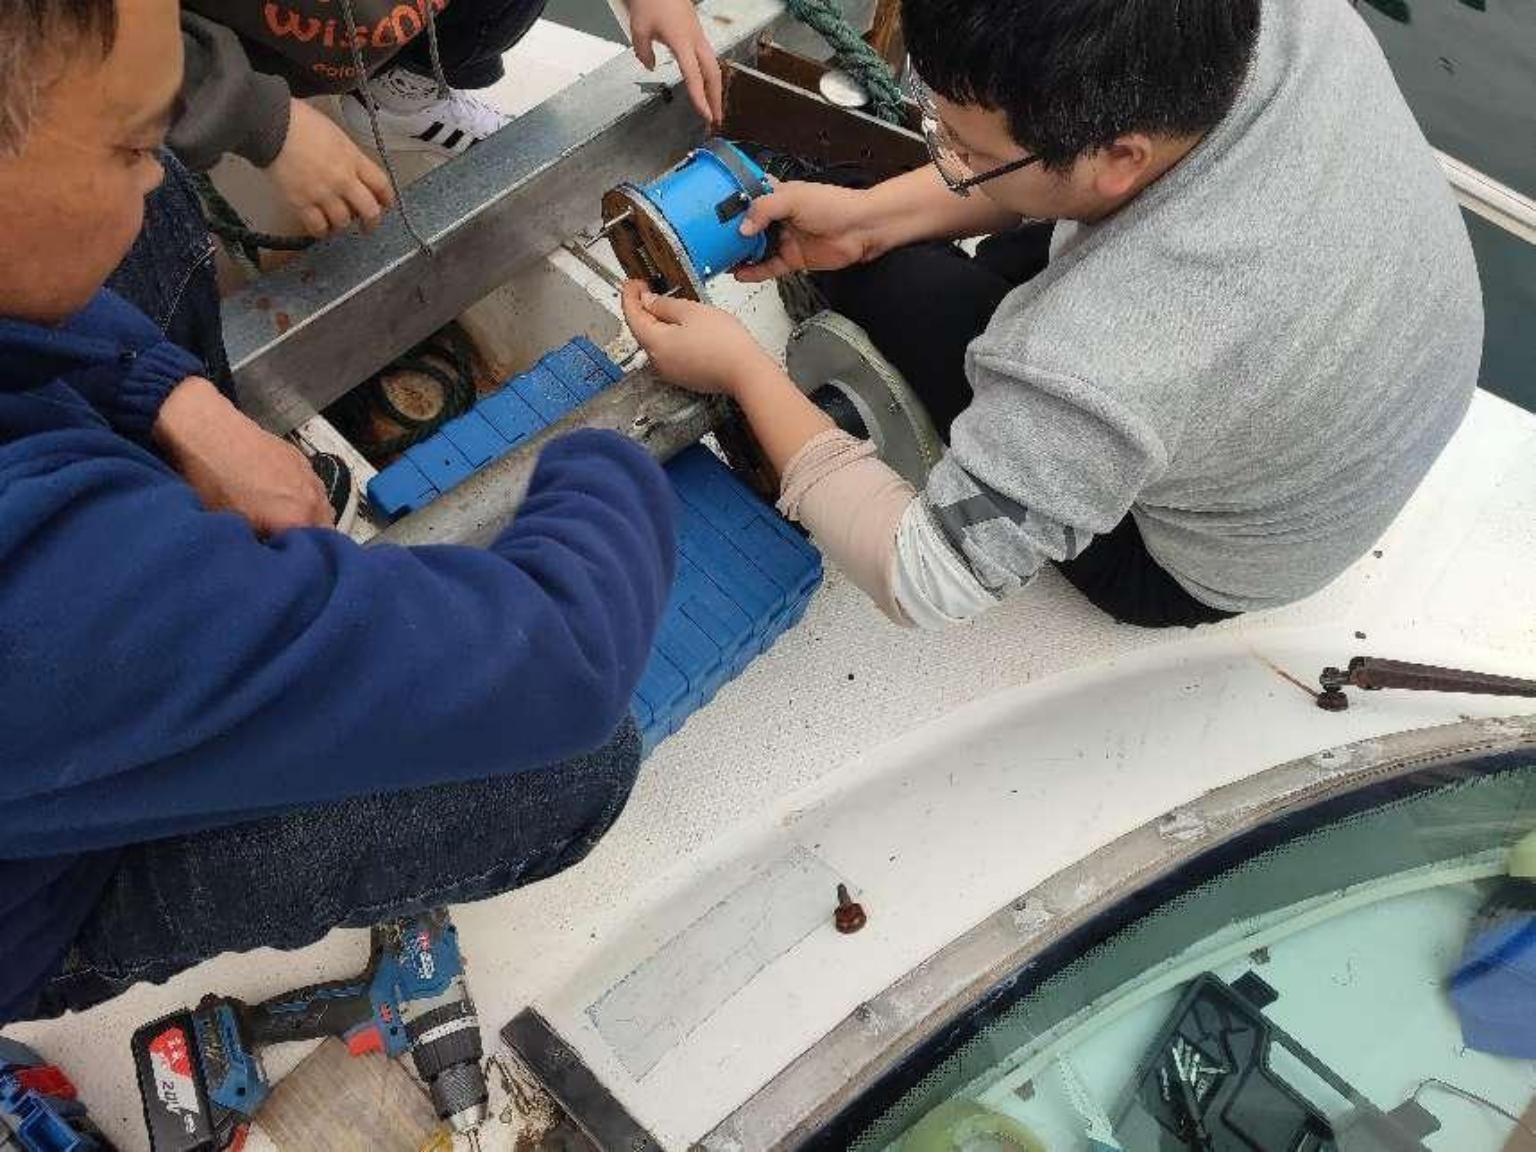
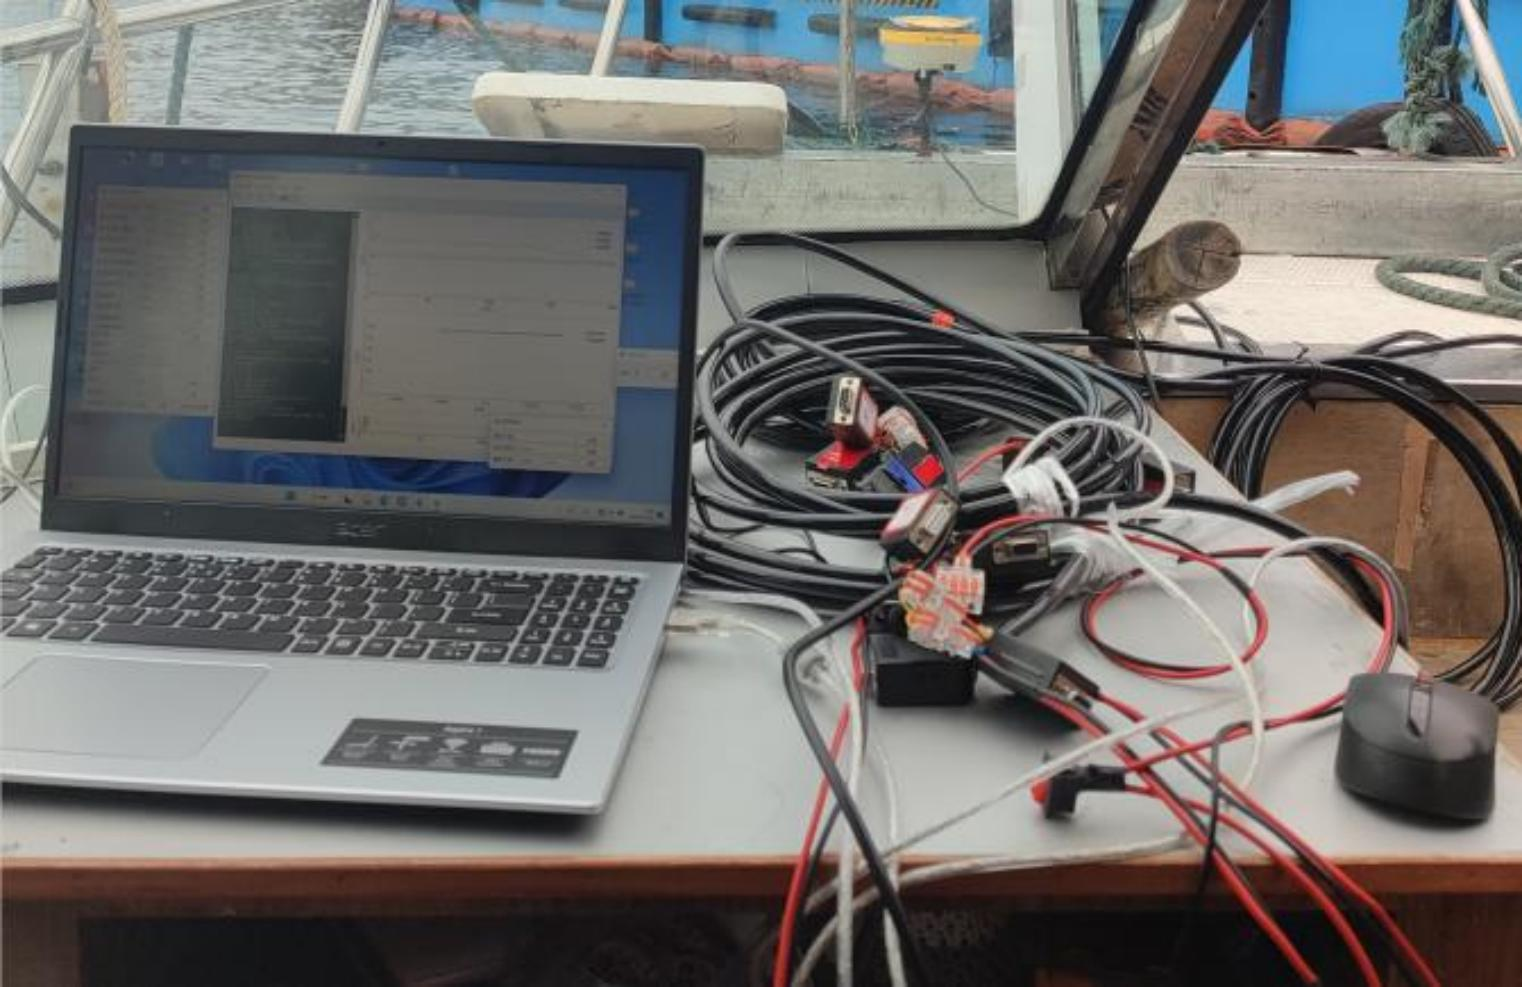
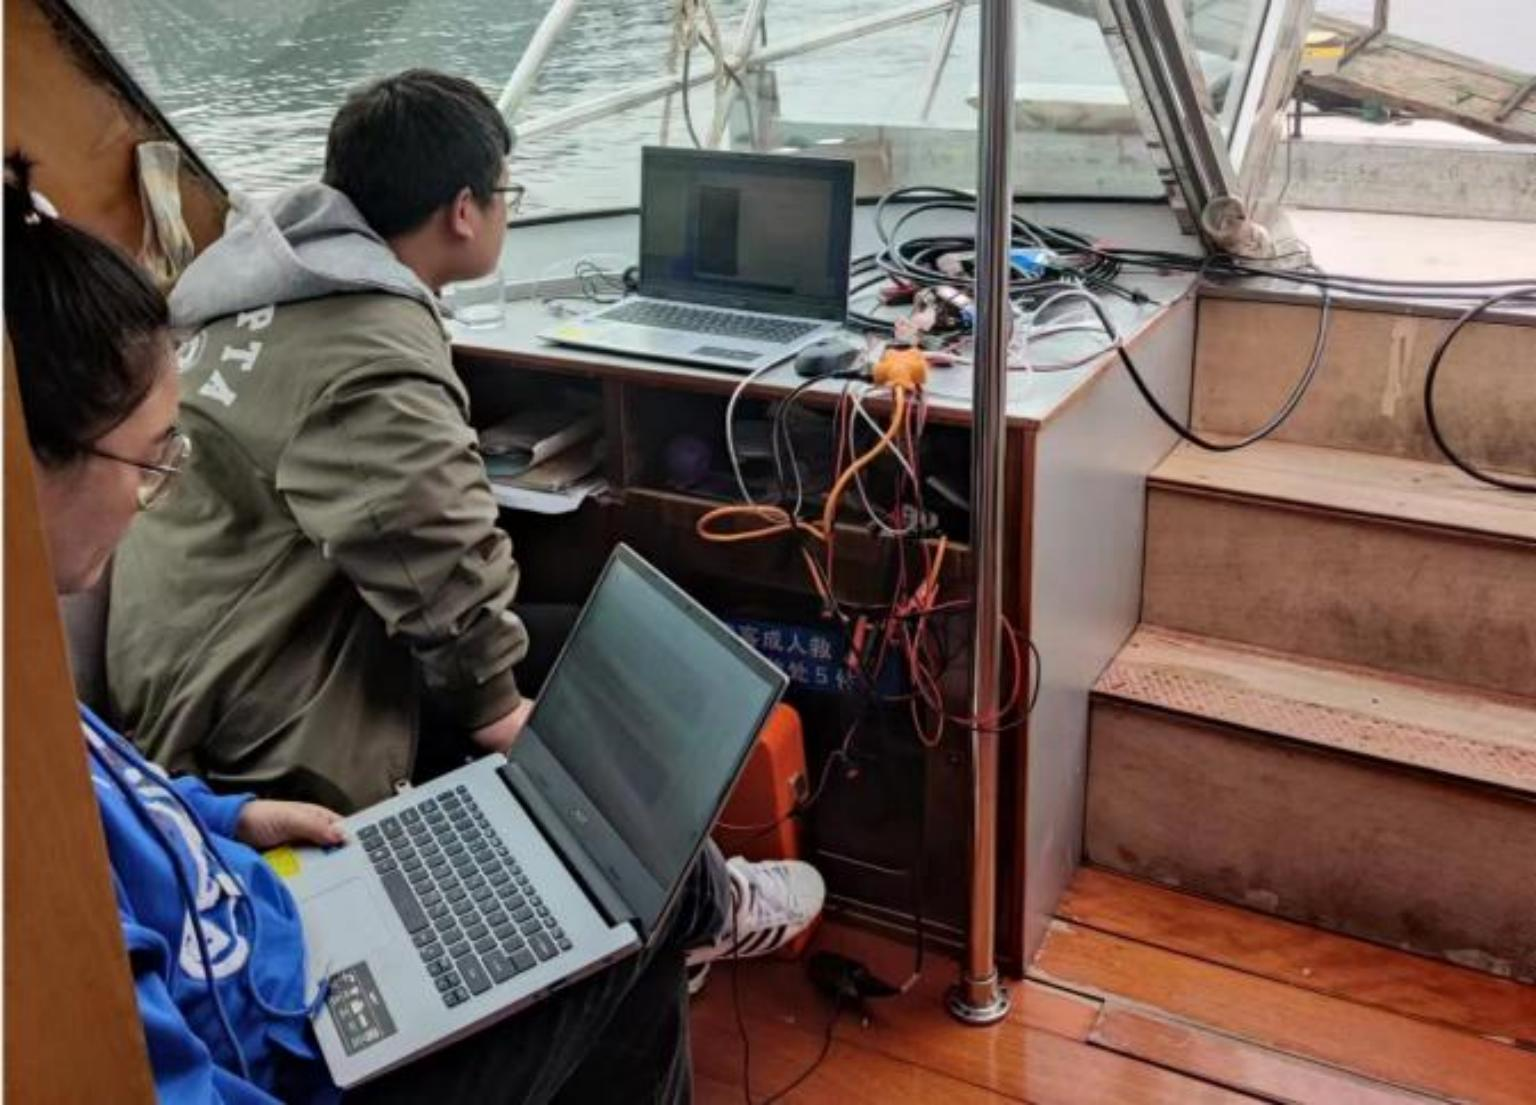
Figure 3.1 Equipment Preparation Stage
GPS installation and commissioning. The customized mounting bracket is equipped with a special screw for GPS. The GPS is screwed onto the screw, and the serial communication cable is routed into the cabin, connected to the computer, and configured to the required output mode GPRMC with an output frequency of 1 Hz.
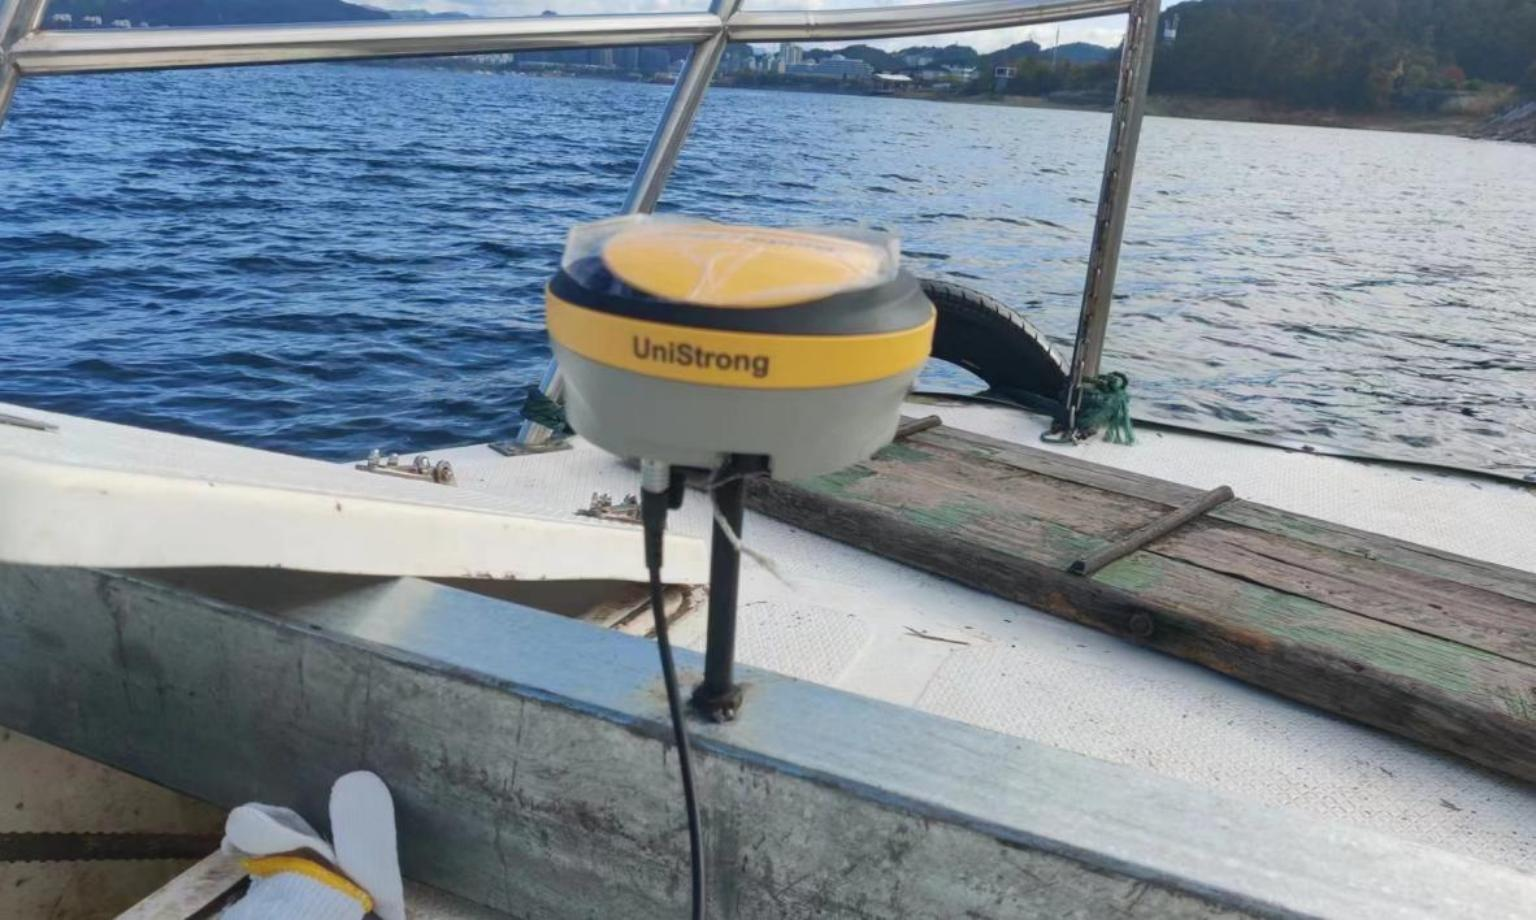
Figure 3.2 GPS Mounting
3.2 Debugging Stage
Internal assembly of the DVL.
Check the wiring of the power transmission, temperature sensor, and attitude sensor to ensure that the four transducer signals are connected clockwise according to the forward direction.
Verify that the memory card and the seven pin headers from the power amplifier board to the conditioning board are properly inserted.
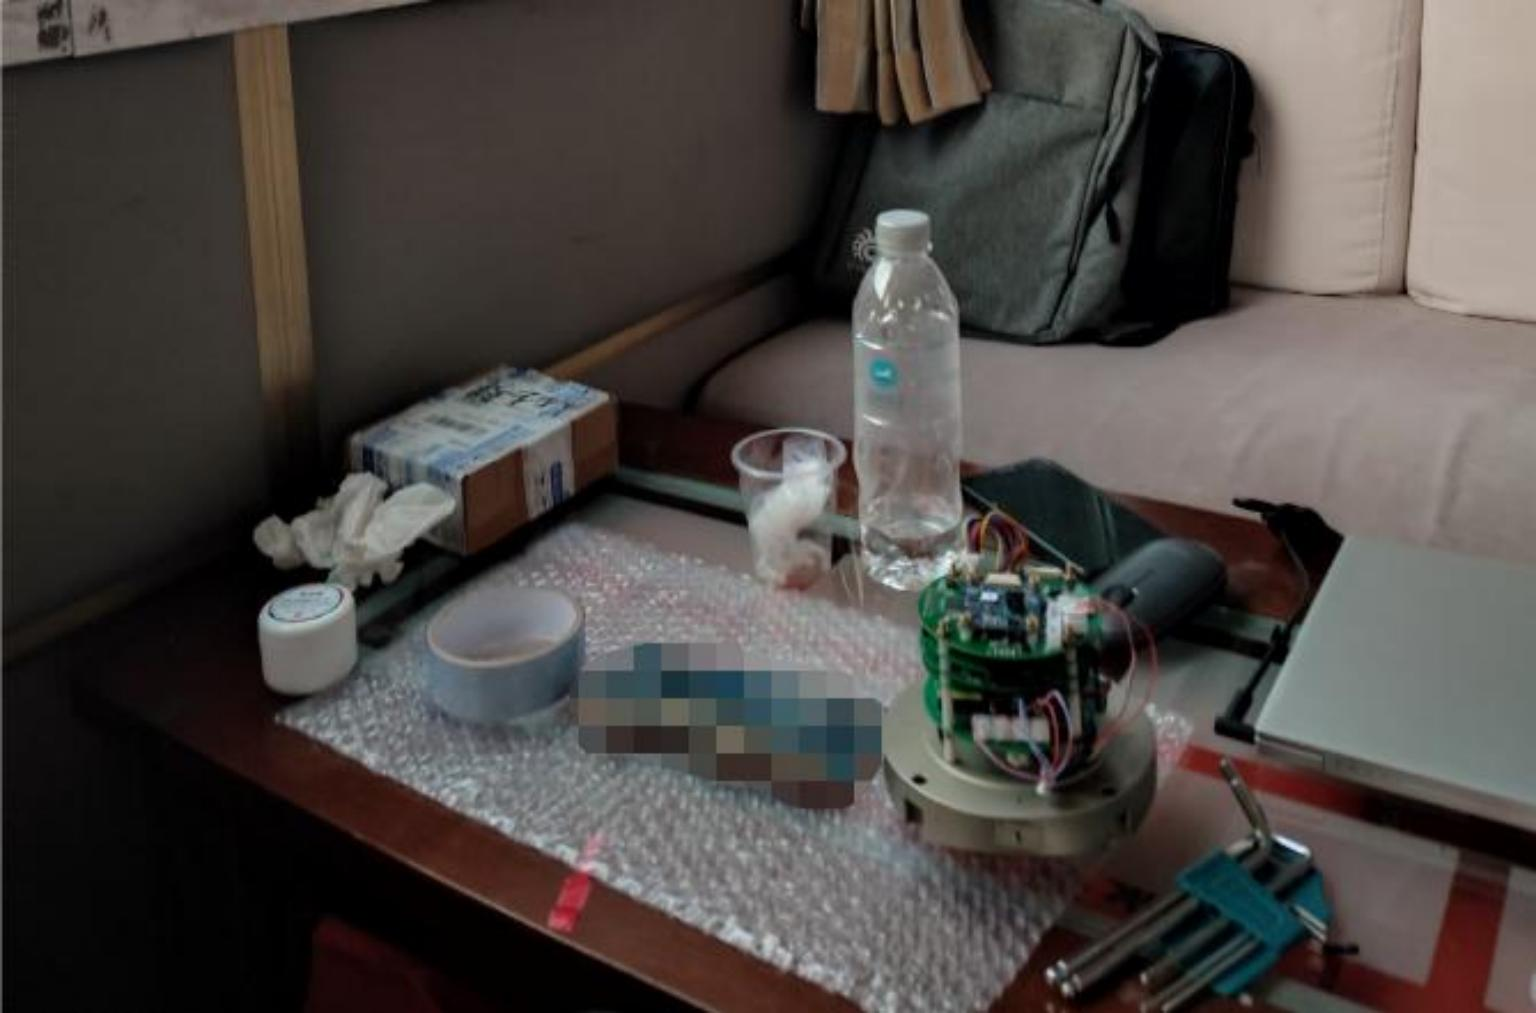
Figure 3.3 Inspection Before Cabin Sealing
- Whether the equipment version information is correct;
- Whether the equipment operates normally;
- Whether the temperature and attitude sensor data are acquired properly.
- Whether the heading angle of the SA item is consistent with the compass direction;
- Whether the temperature of the SA item is approximately consistent with the actual ambient temperature.
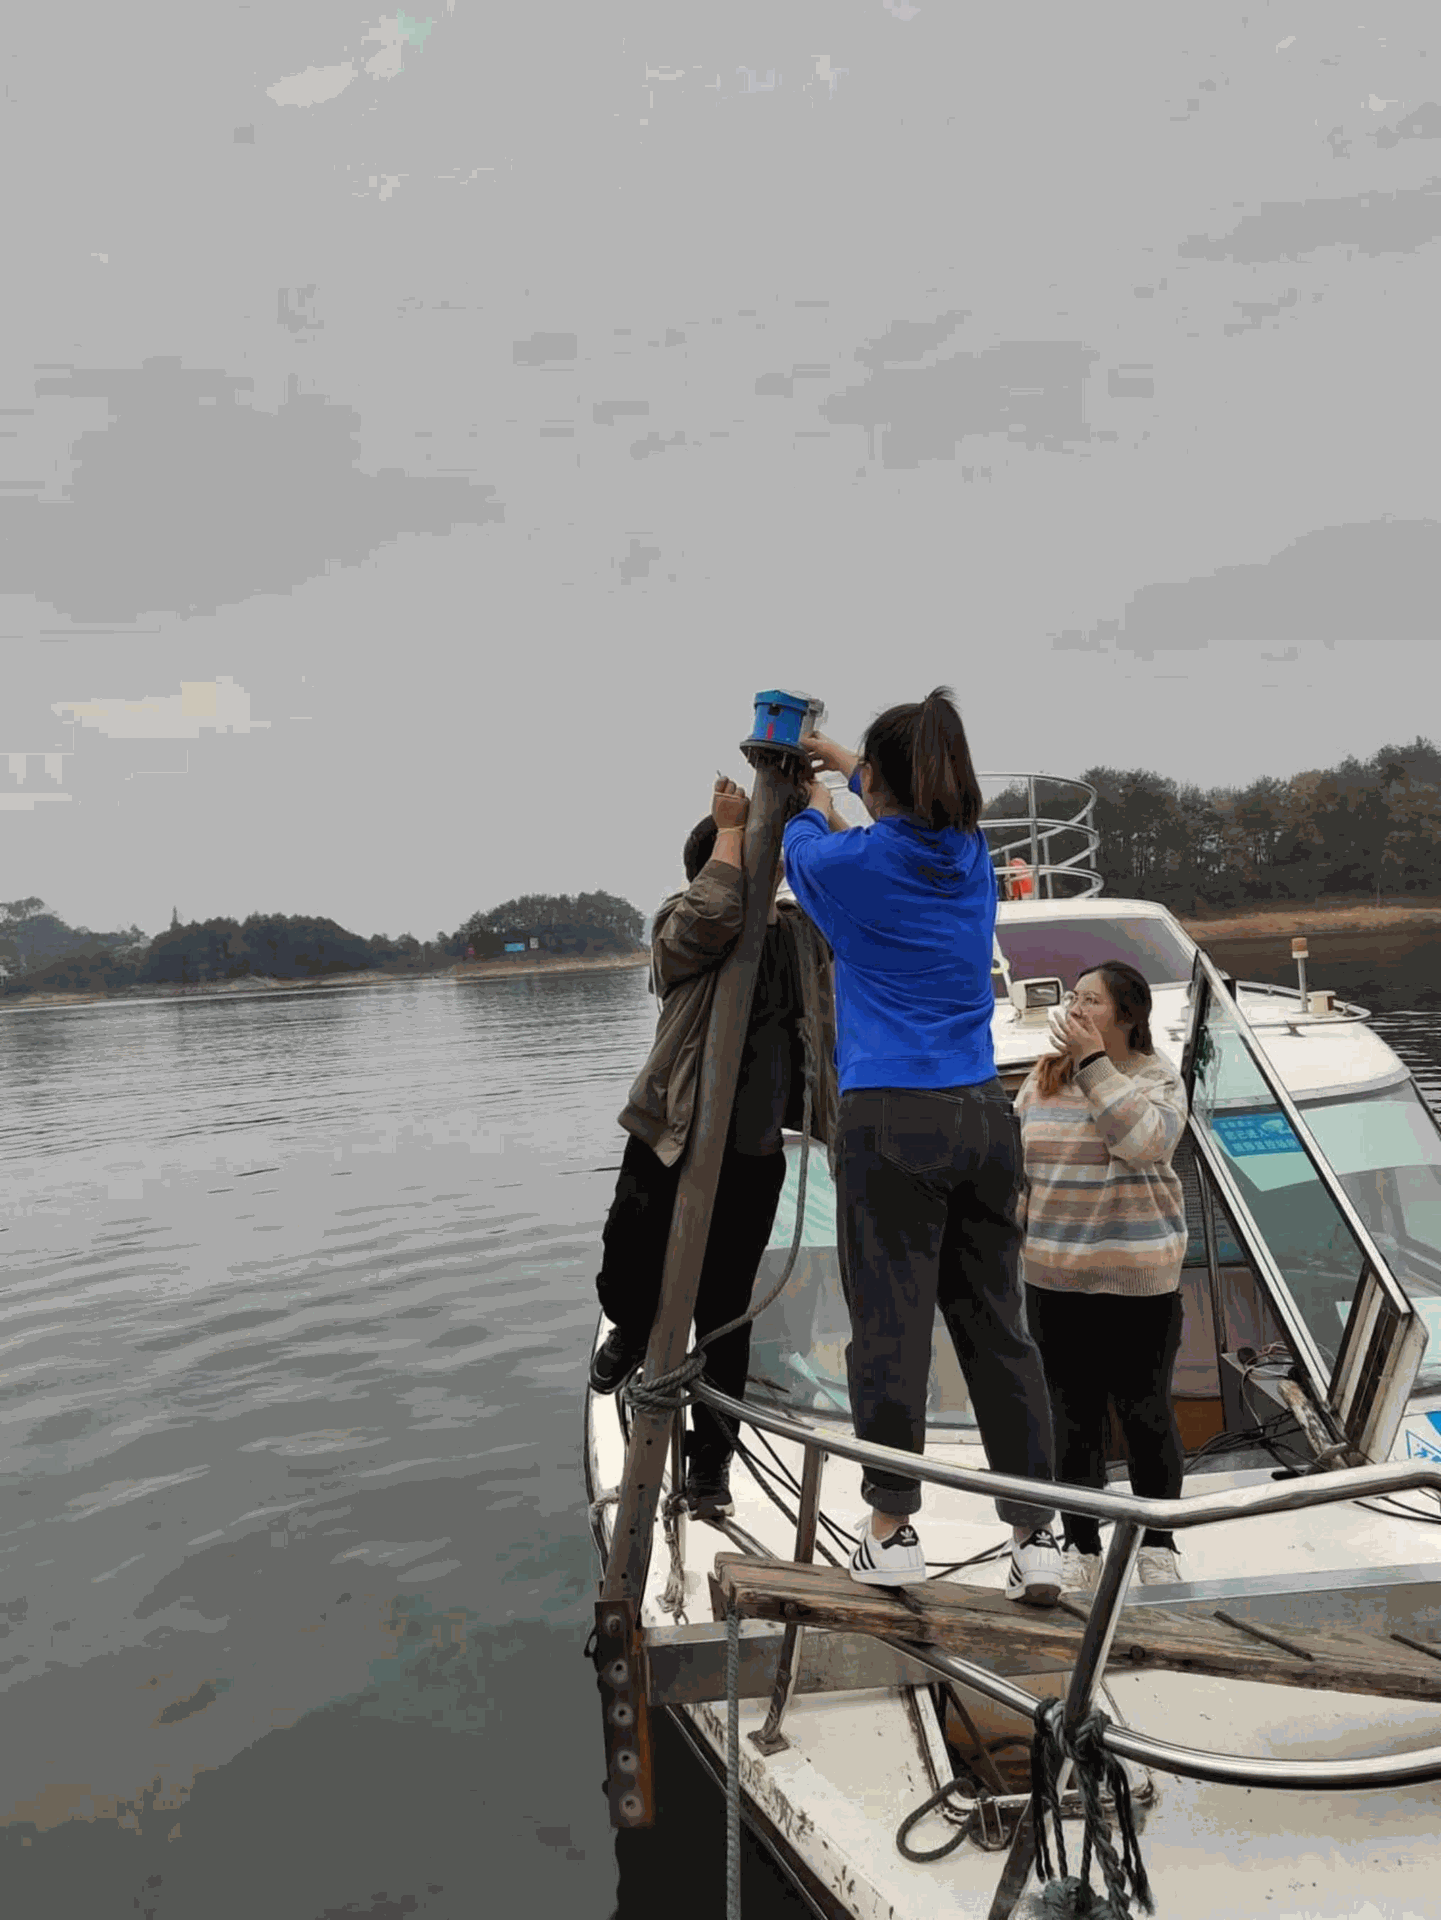
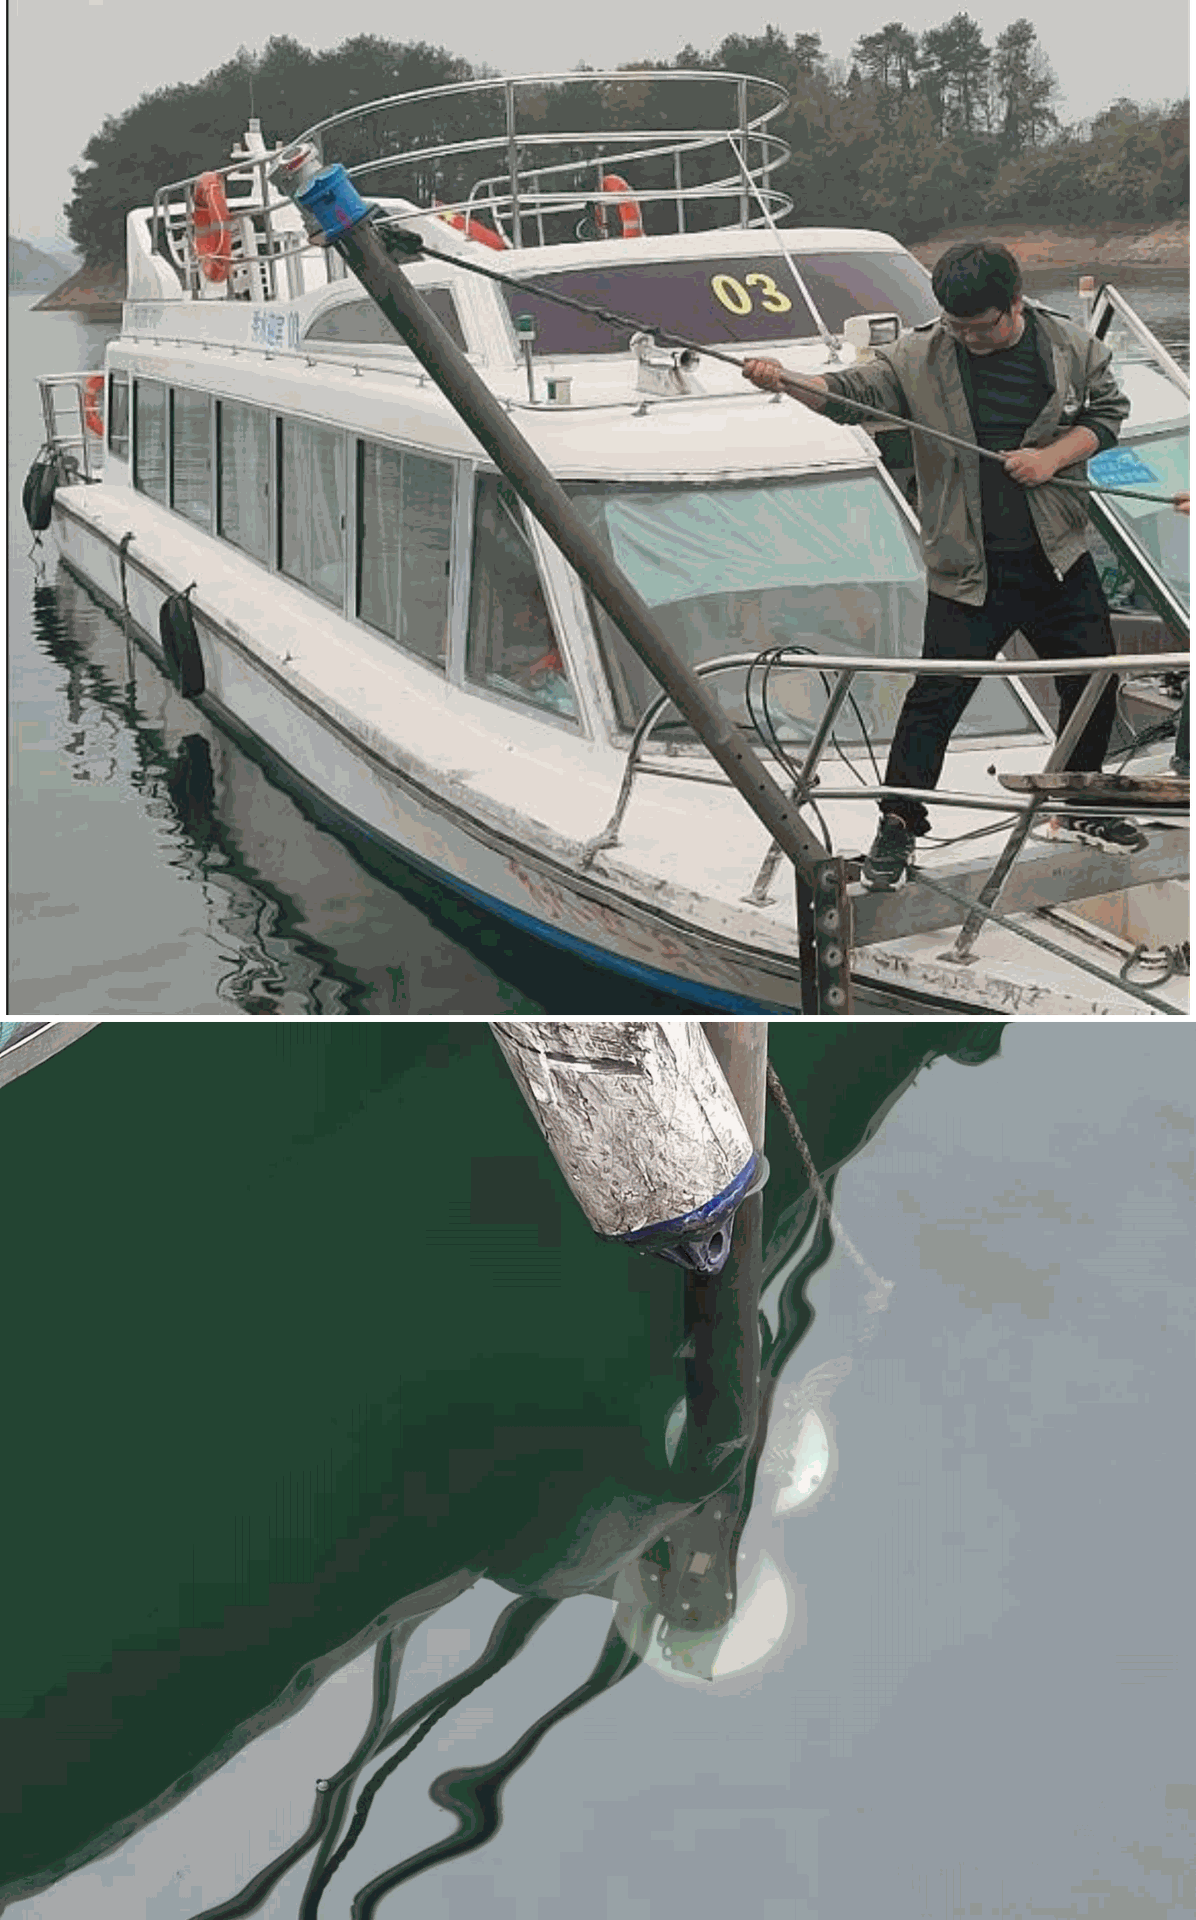
Figure 3.4 Equipment Installation and Fixation
3.3 Test Results
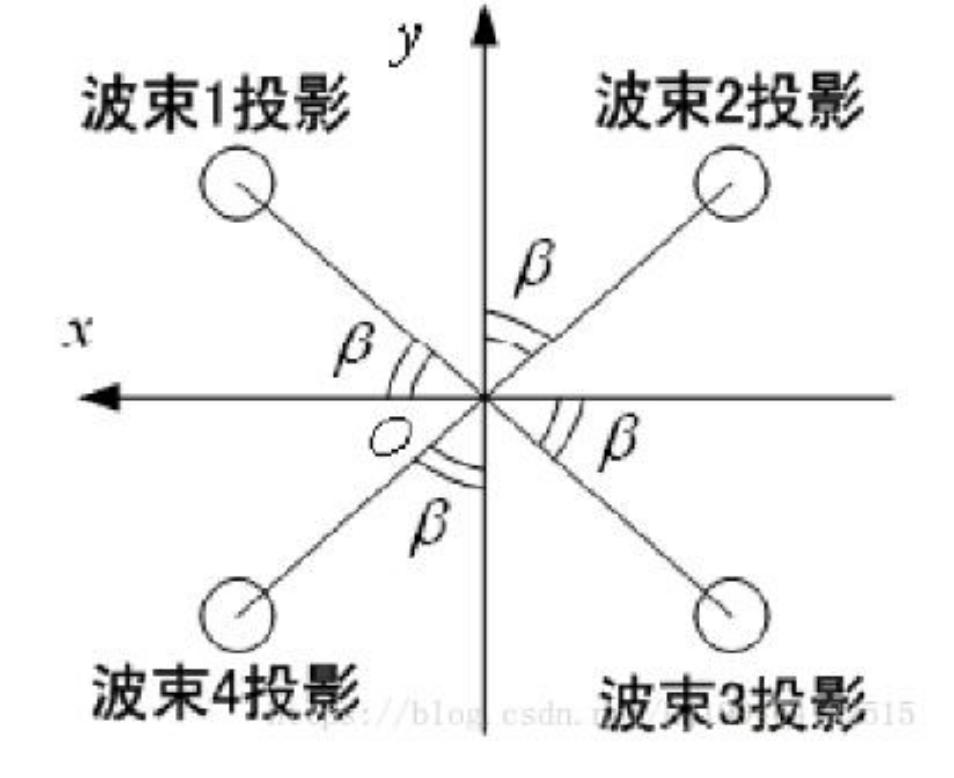
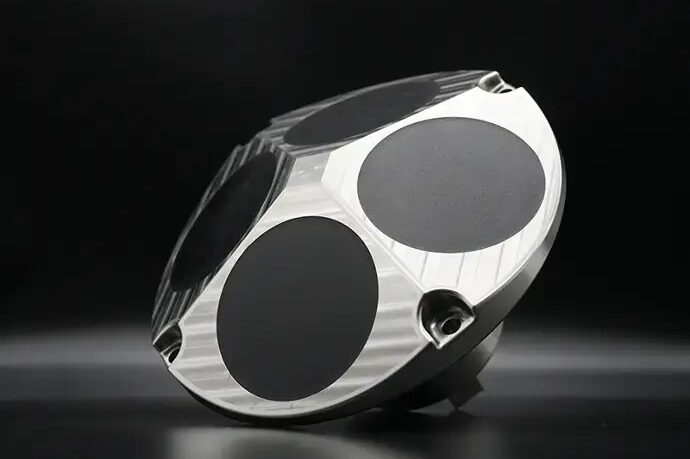
Figure 3.5 Equipment Installation Orientation
Where x denotes the forward direction of the vessel.
The angle of Equipment 1 (blue unit in Figure 3.4) is 45°, and the angle of Equipment 2 (silver unit in Figure 3.4) is 0°.
3.3.1 Test Results of Equipment 1
Equipment 1 completed a total of 3 valid routes. During the route test, the equipment parameters were set to automatic mode. The pulse width, transmission power and other parameters were automatically adjusted according to the real-time measured lake bottom depth, resulting in simple and convenient operation.
(1)Route 1
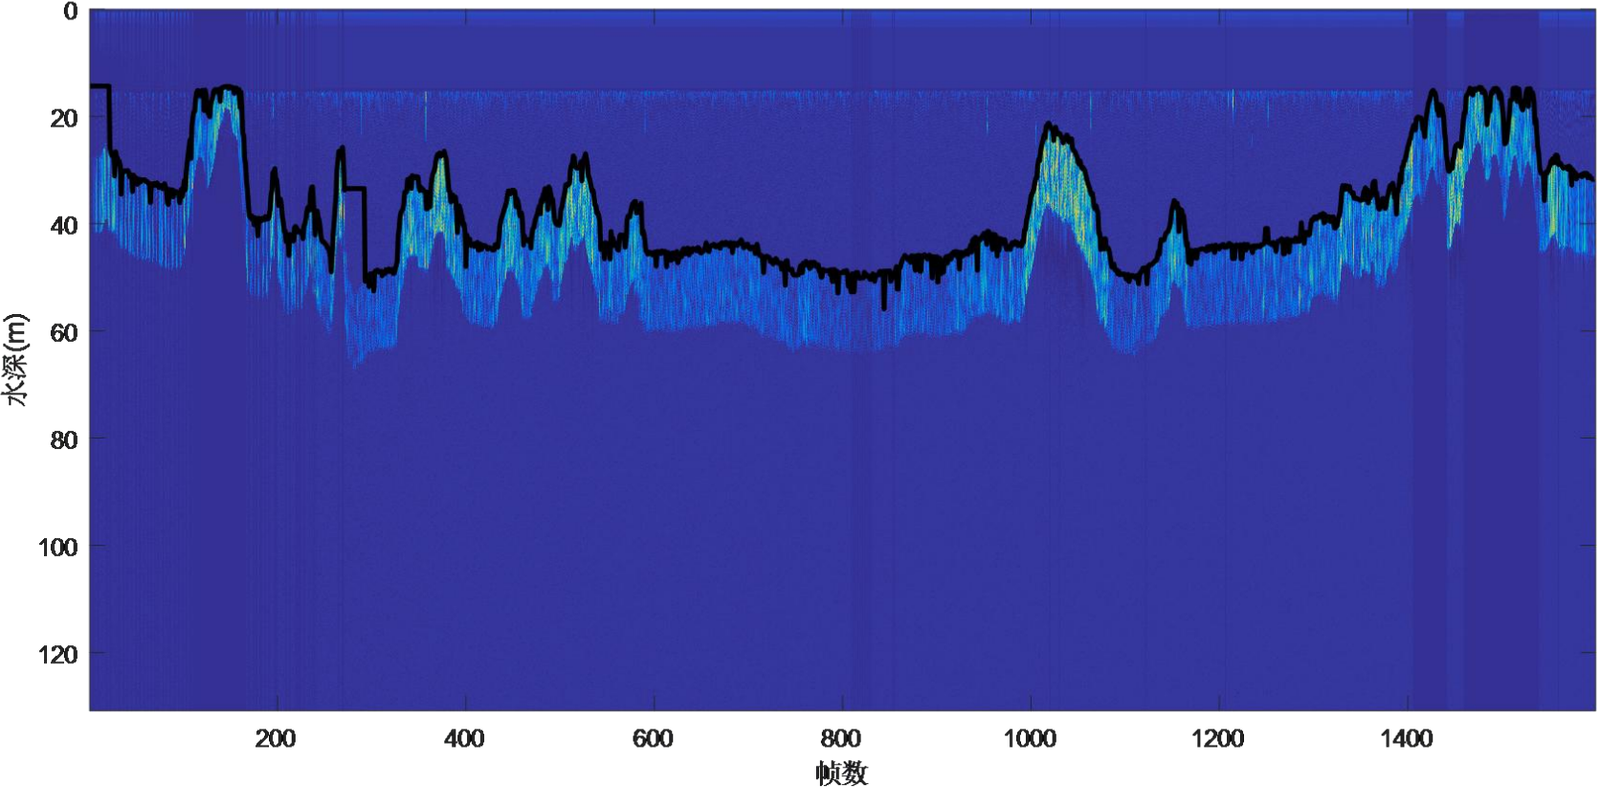
Figure 3.6 Stable Bottom Tracking Results
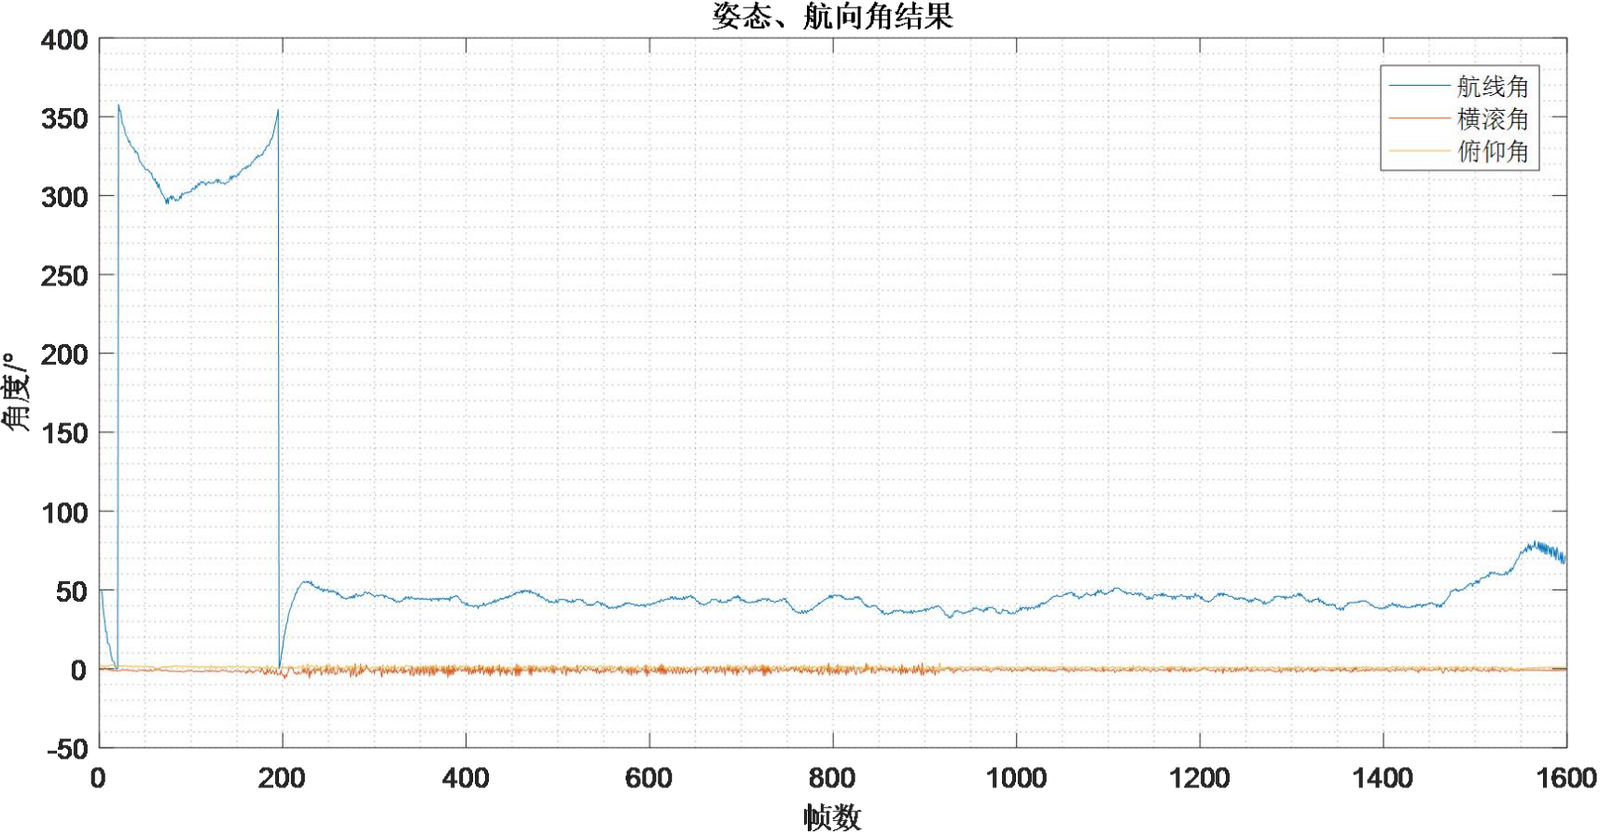
Figure 3.7 Attitude and Heading Angle
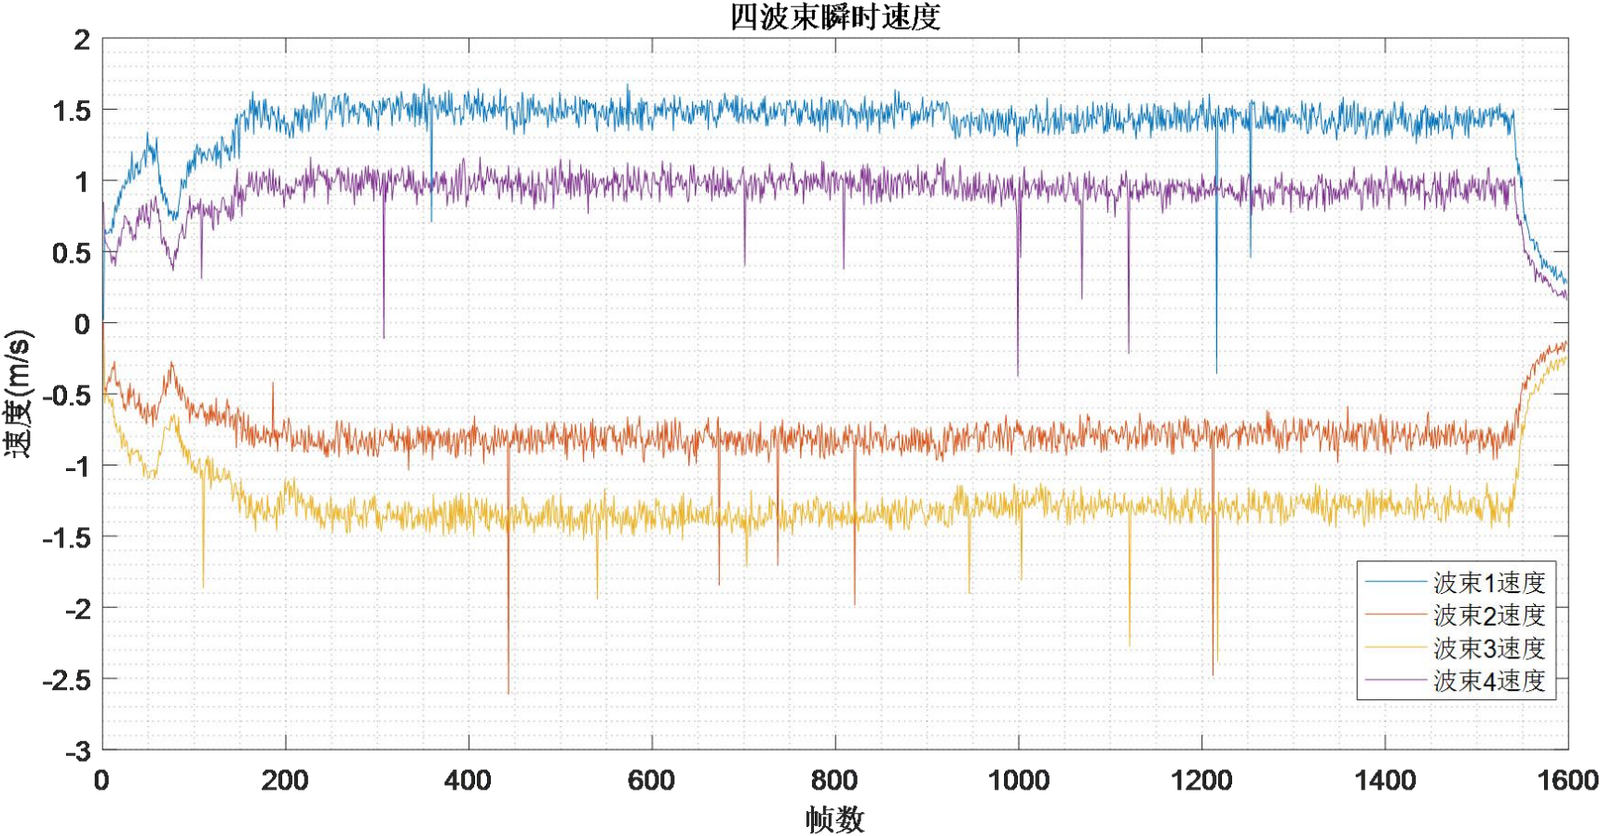
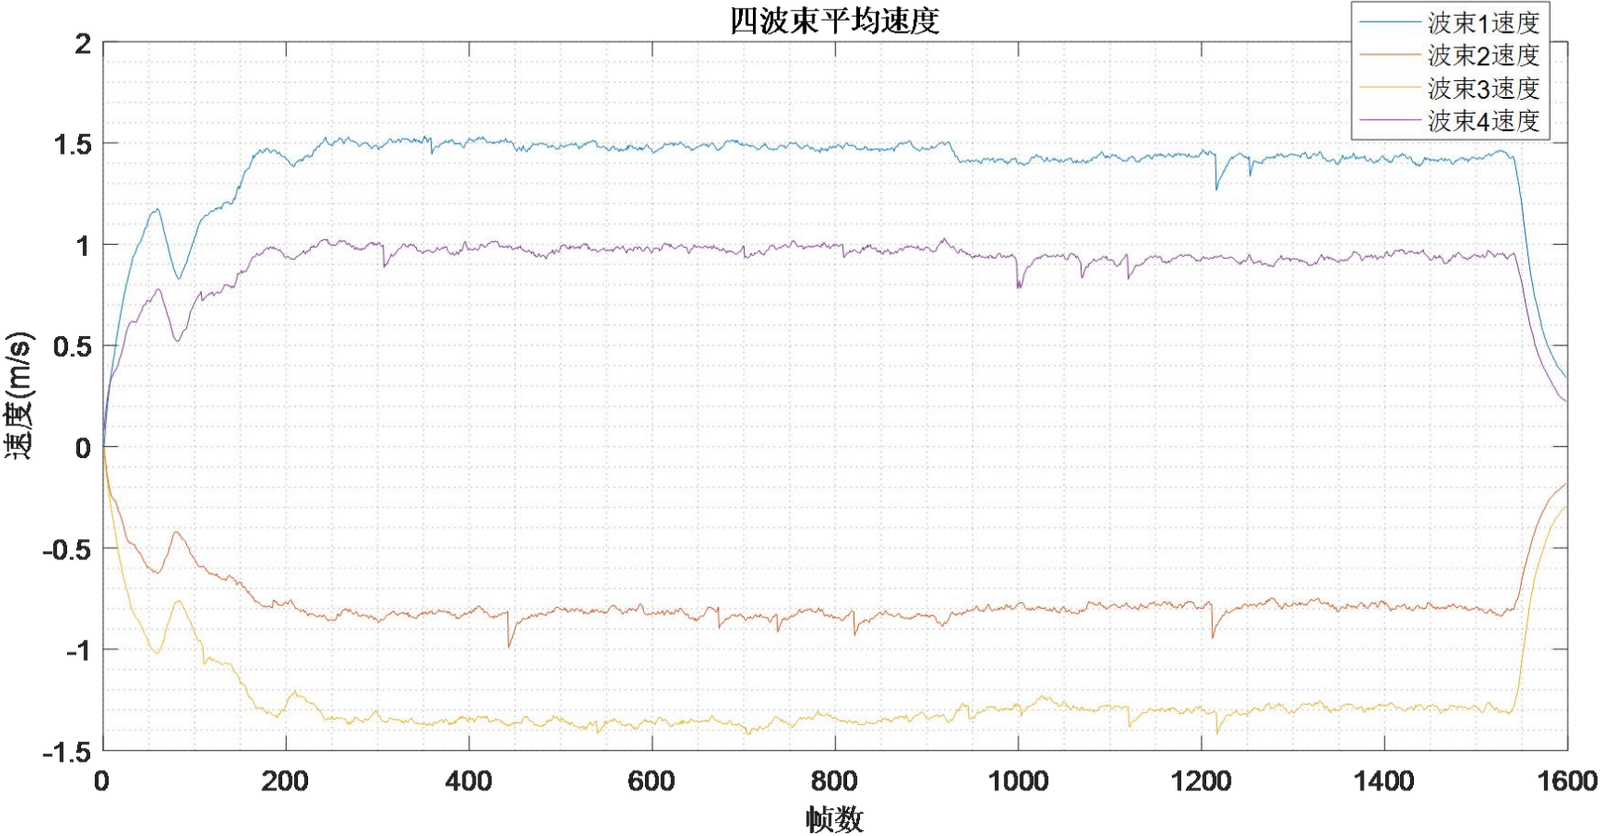
Figure 3.8 Velocity Calculation Results in Beam Coordinates
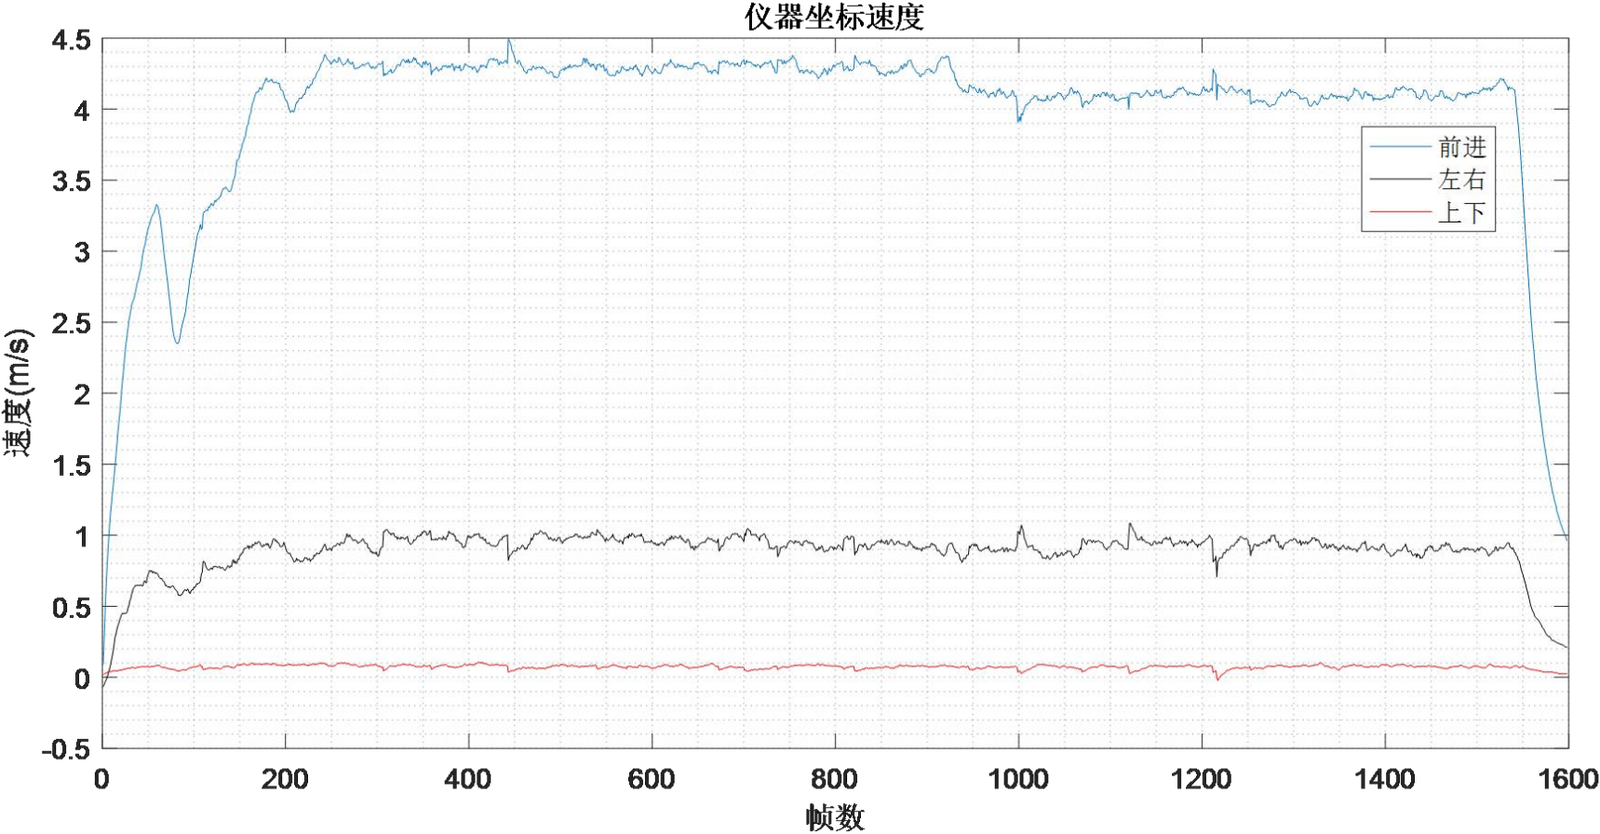
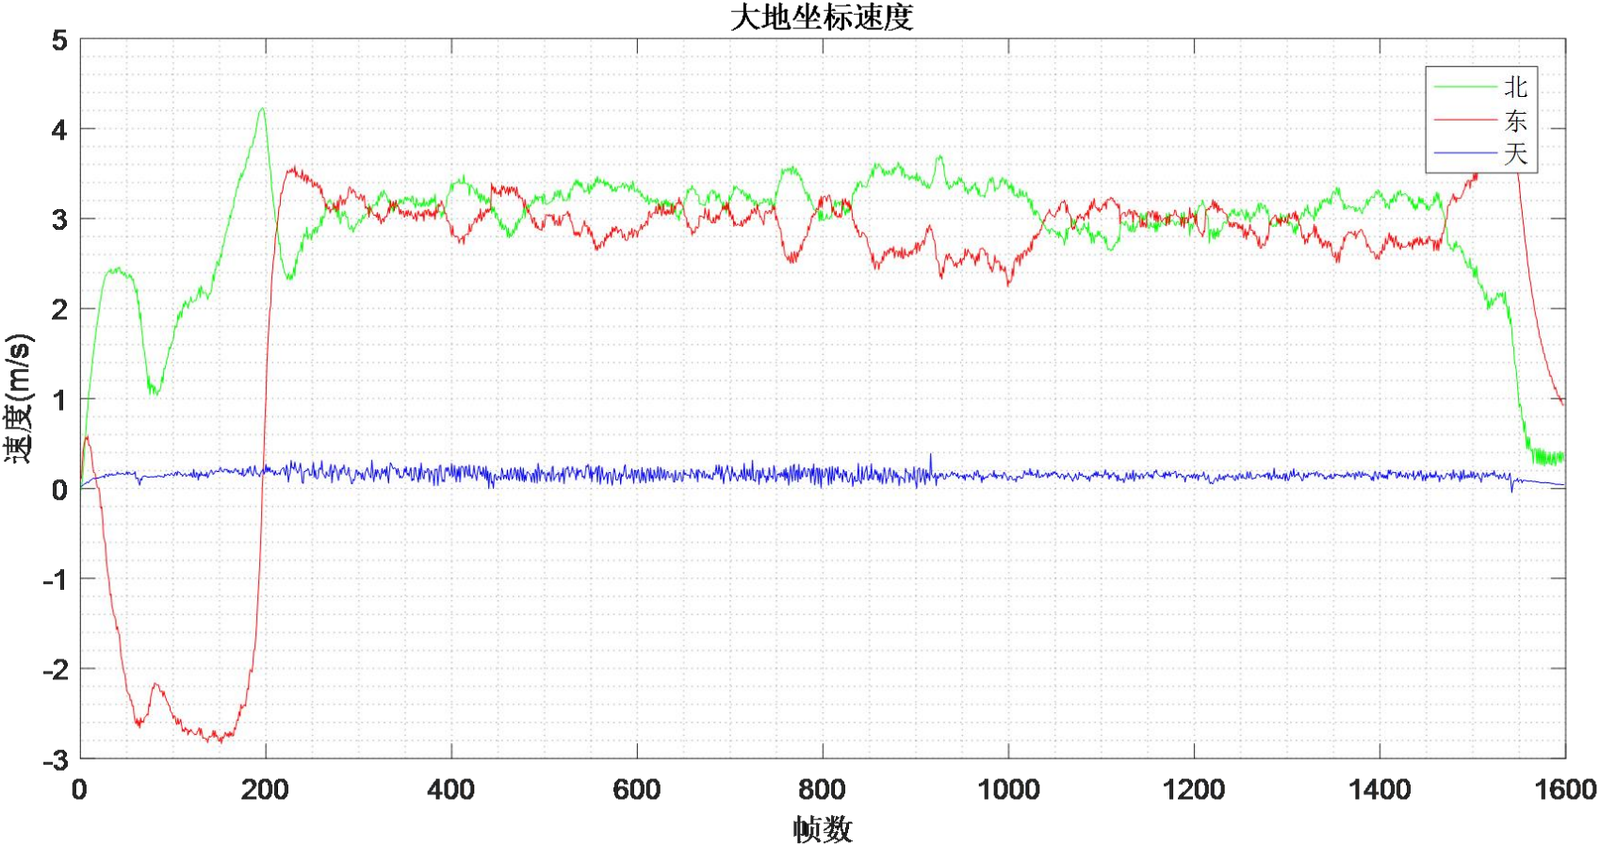
Figure 3.10 Velocity Calculation Results in Earth Coordinates
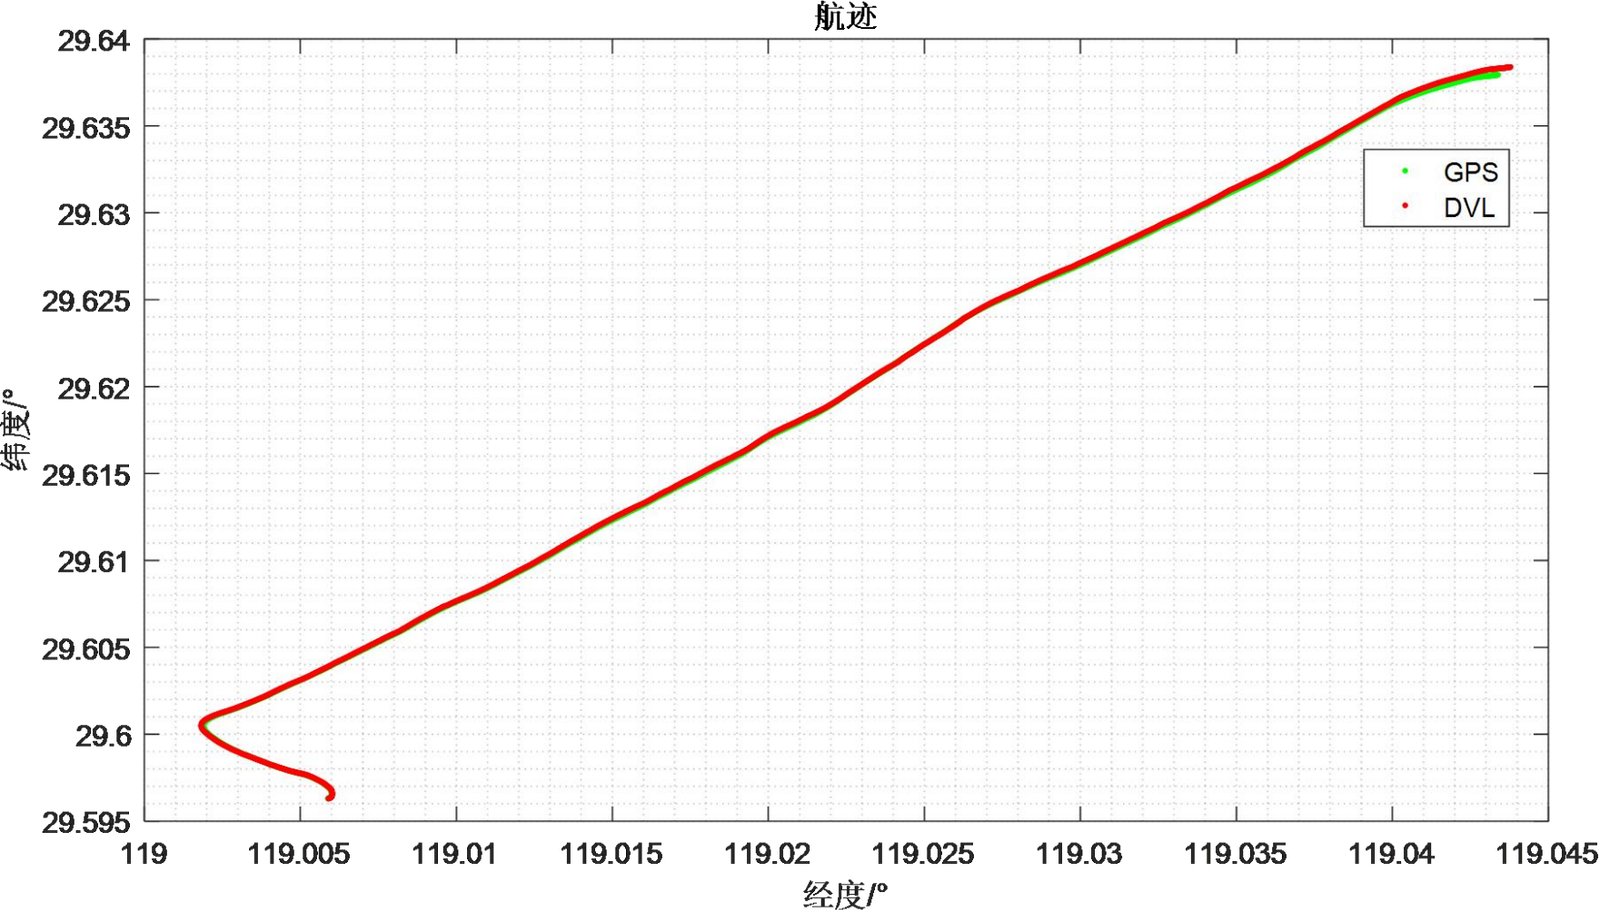
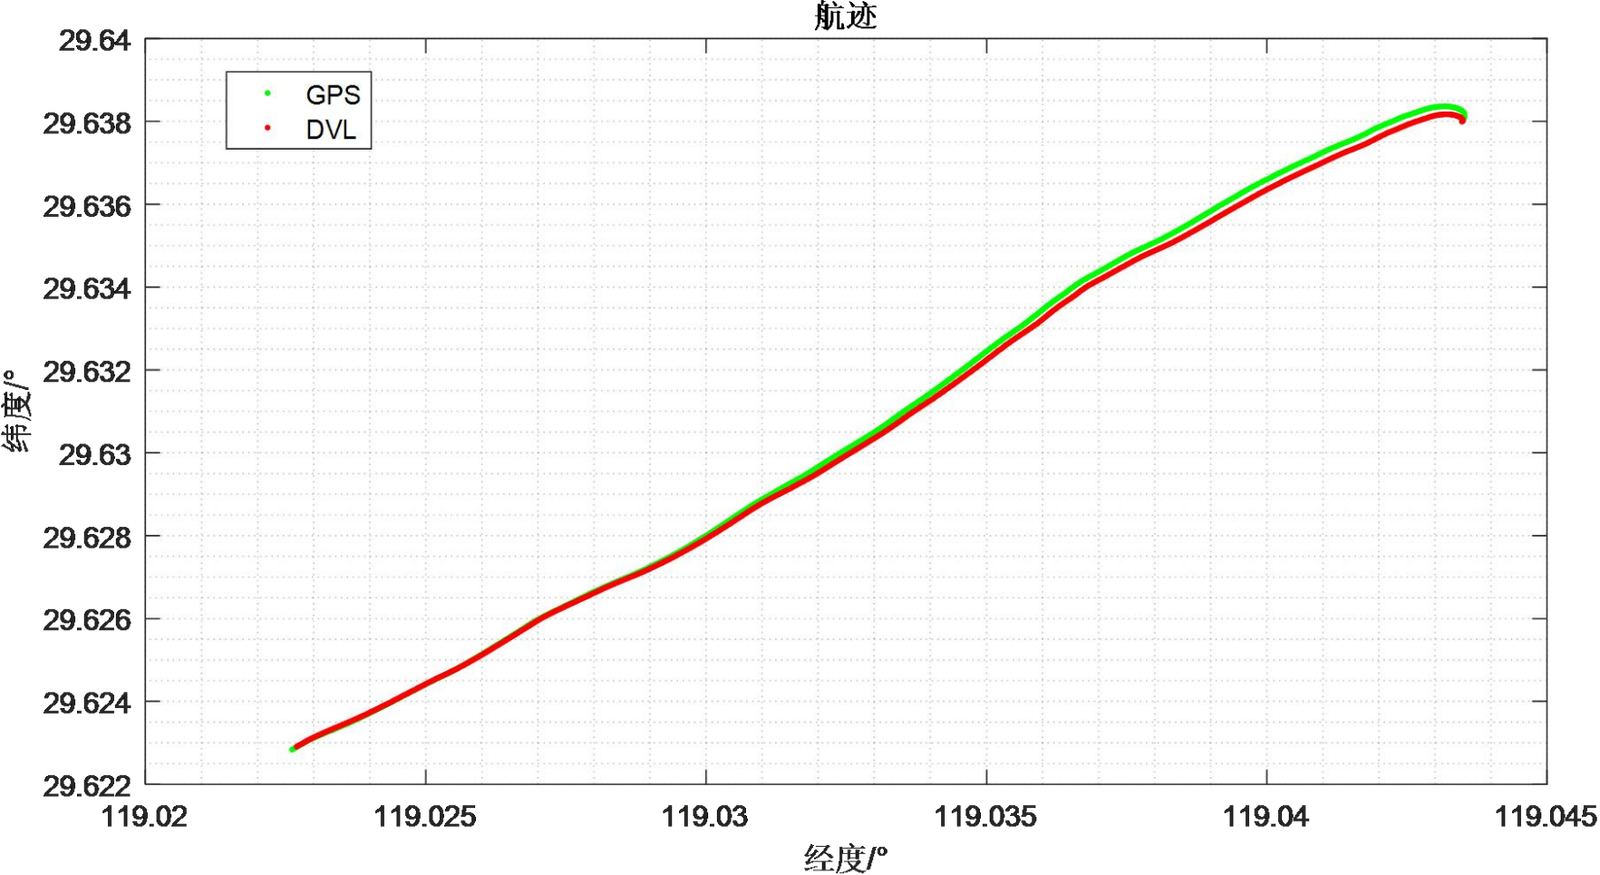
Figure 3.11 Range Comparison Results between DVL and GPS
As can be seen from Figure 3.11, the range calculated by the DVL-600K (red) is basically consistent with the range recorded by GPS (green) during Route 1.
The total range is 6458.3 m, and the end-point deviation between the two is 19.1 m, with a relative error of 2.9‰.
This sufficiently proves that the equipment has accurate range calculation capability.
(2)Route 2
Route 2 lasted approximately 700 seconds, during which the test vessel maintained a speed of about 6–7 knots, with a total range of approximately 2.5 km.
Throughout the process, the equipment maintained stable lake bottom tracking, stable and accurate speed measurement, and precise range calculation.
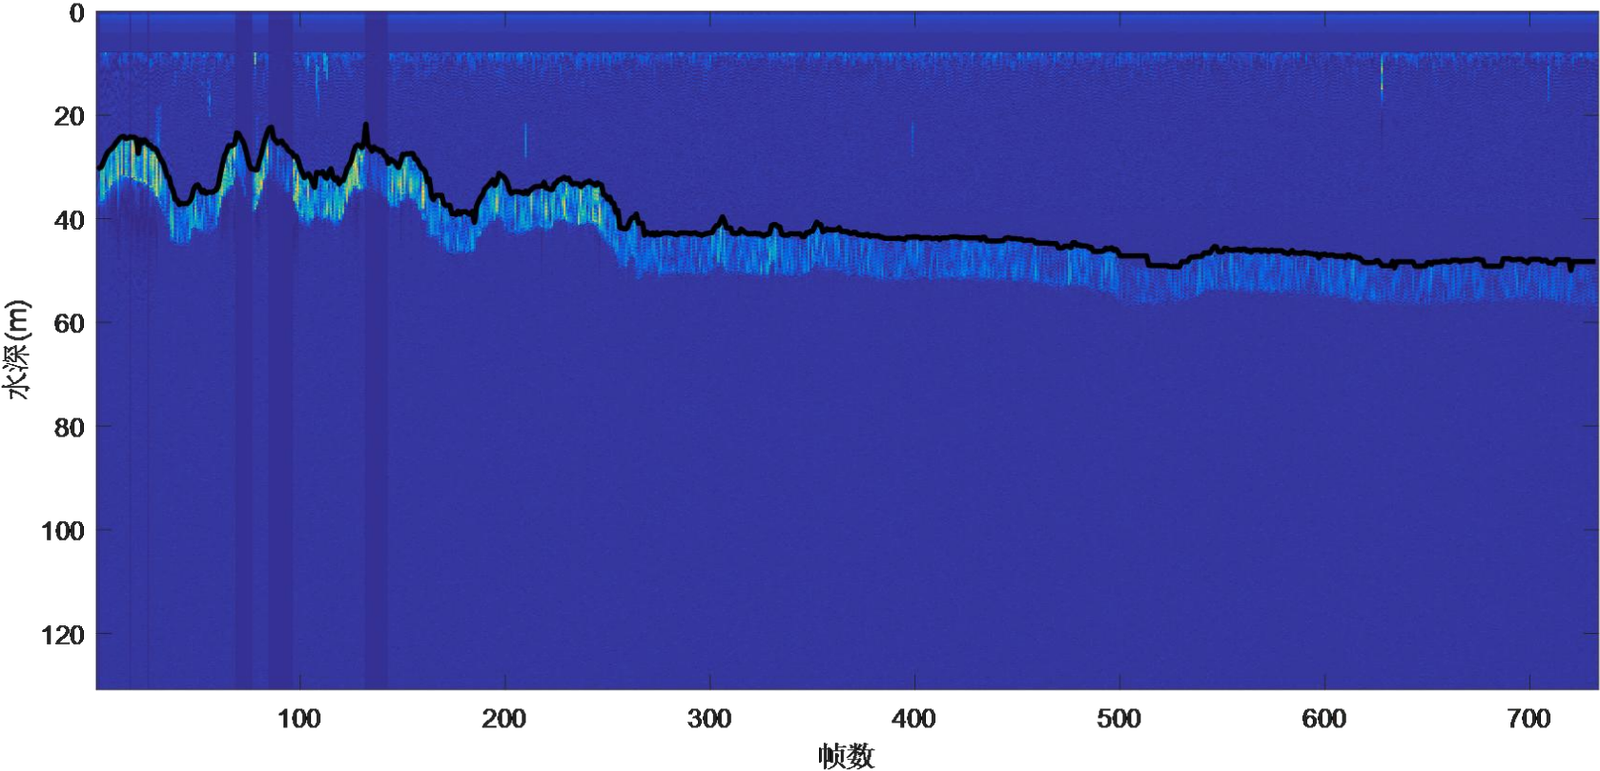
Figure 3.12 Stable Lake Bottom Tracking Results
It can be seen from Figure 3.12 that during Route 2, the lake bottom topography fluctuated drastically at the beginning and then stabilized, with depths varying continuously from 20 m to 60 m. Nevertheless, Equipment 1 still maintained stable bottom tracking, which proves that the equipment is capable of stably tracking complex lake (sea) bottoms.
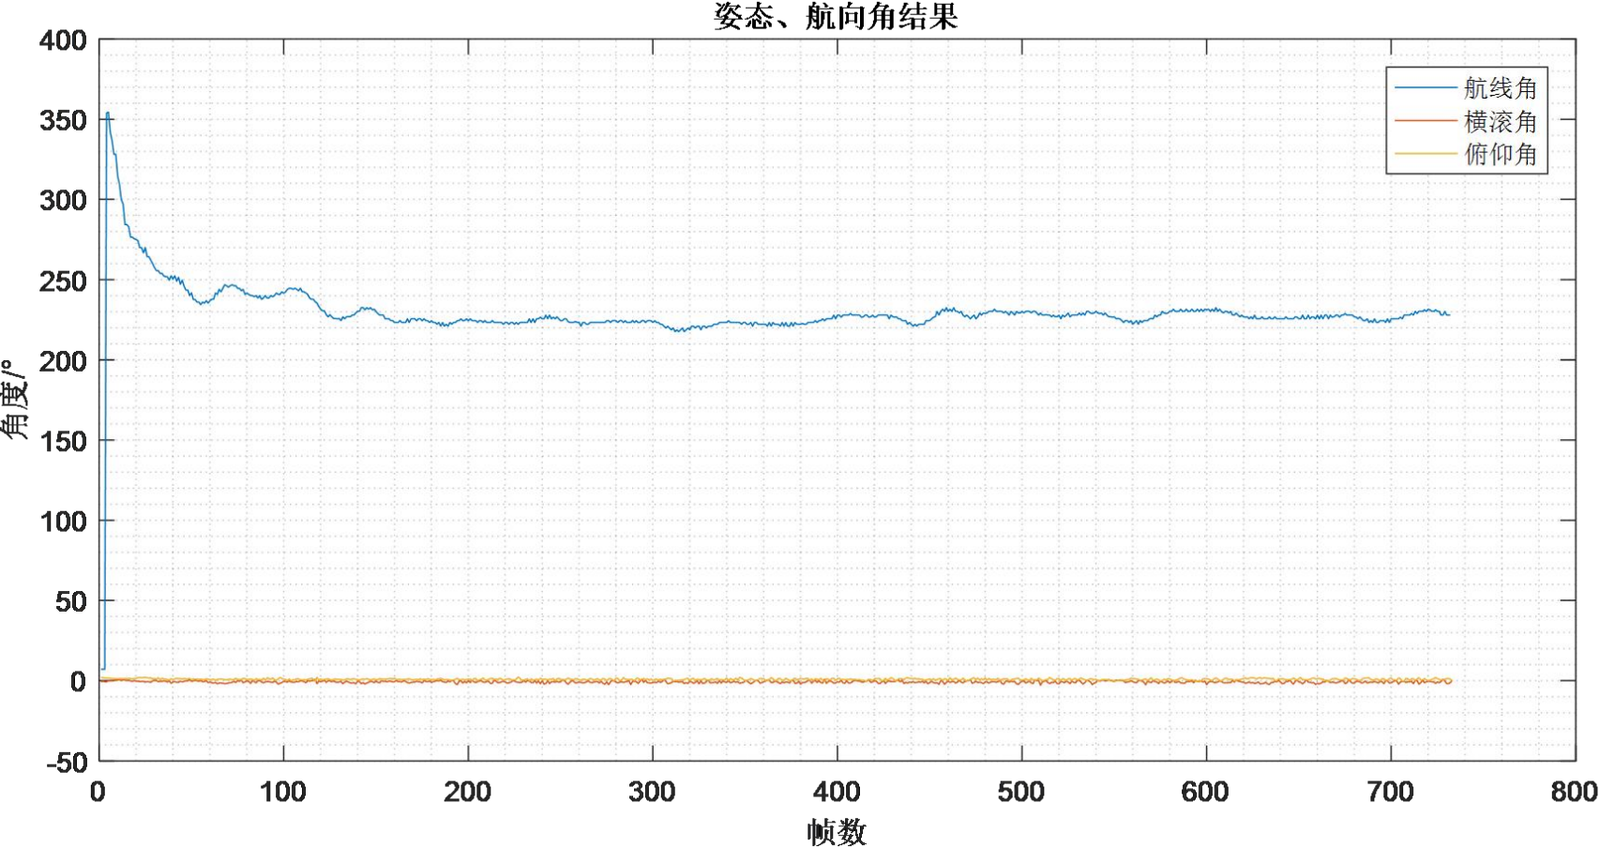
Figure 3.13 Attitude and Heading Angle
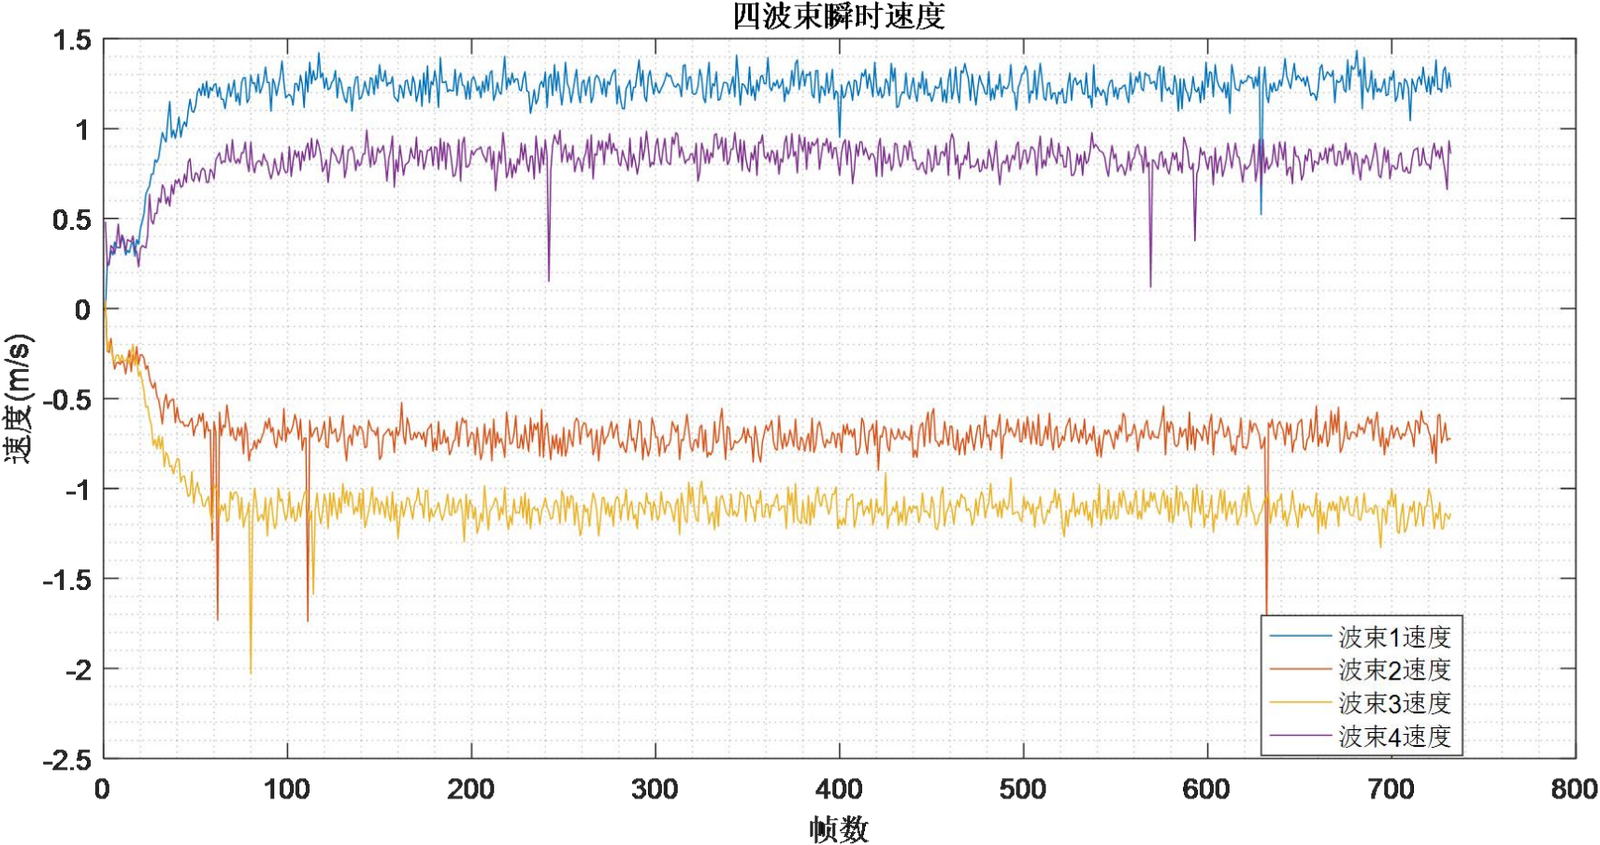
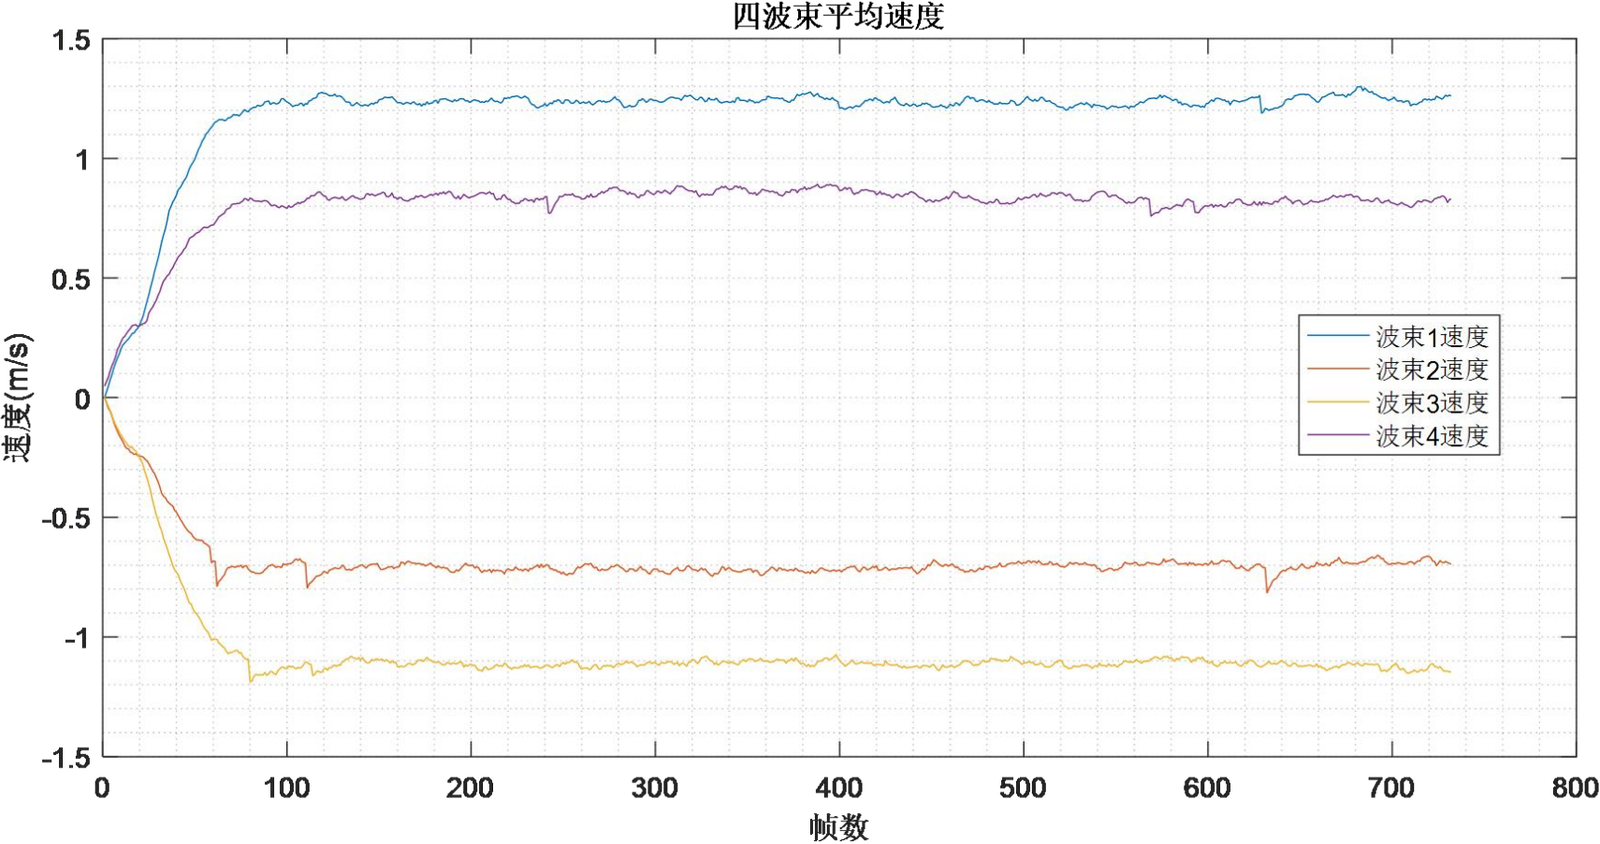
Figure 3.14 Velocity Calculation Results in Beam Coordinates
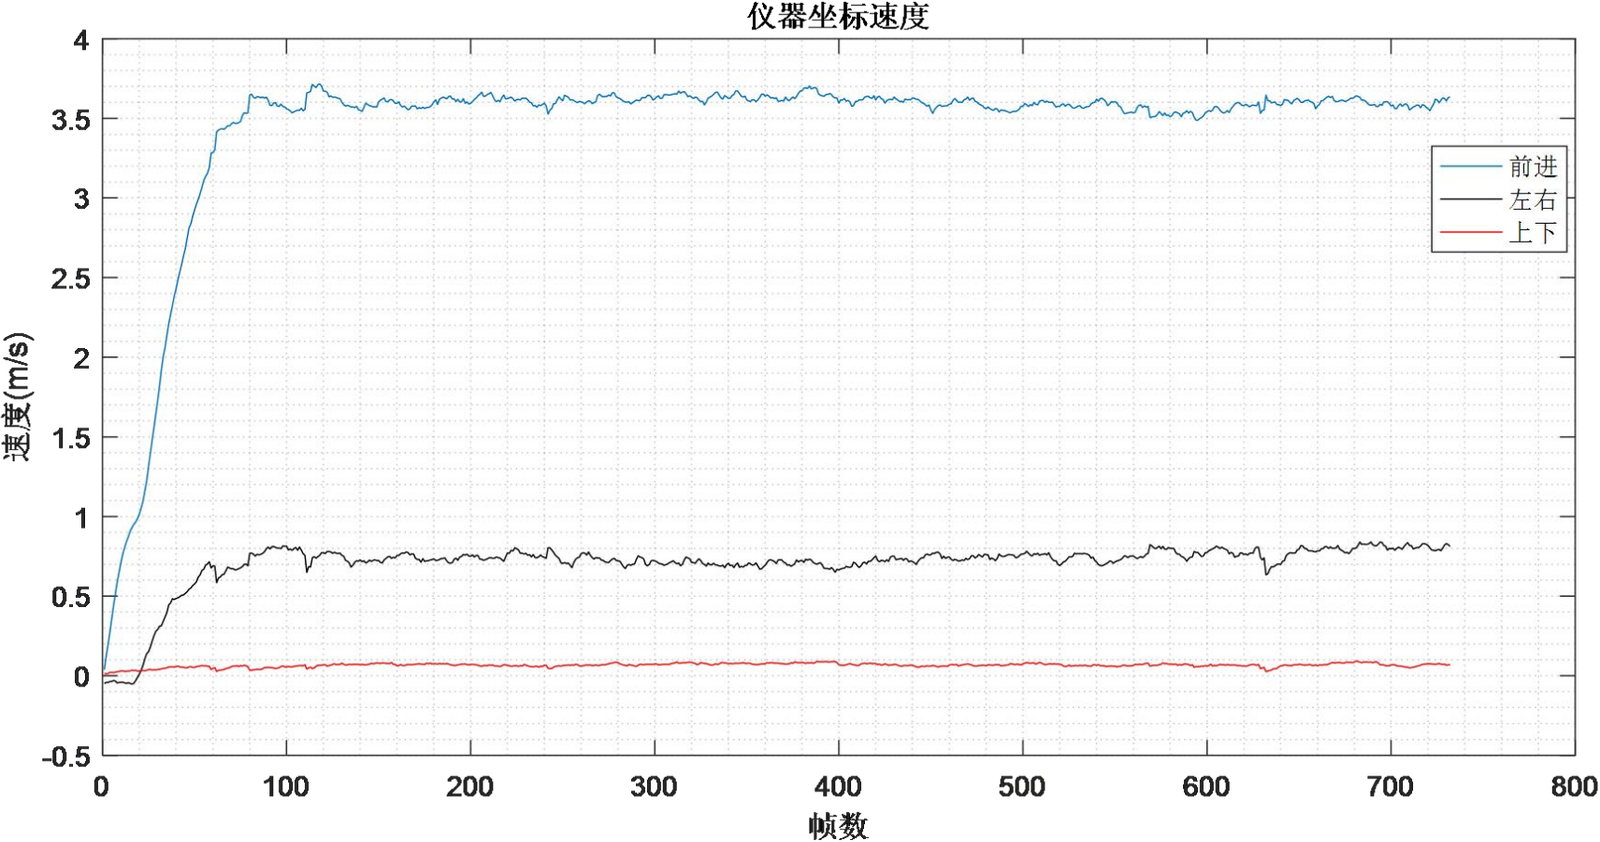
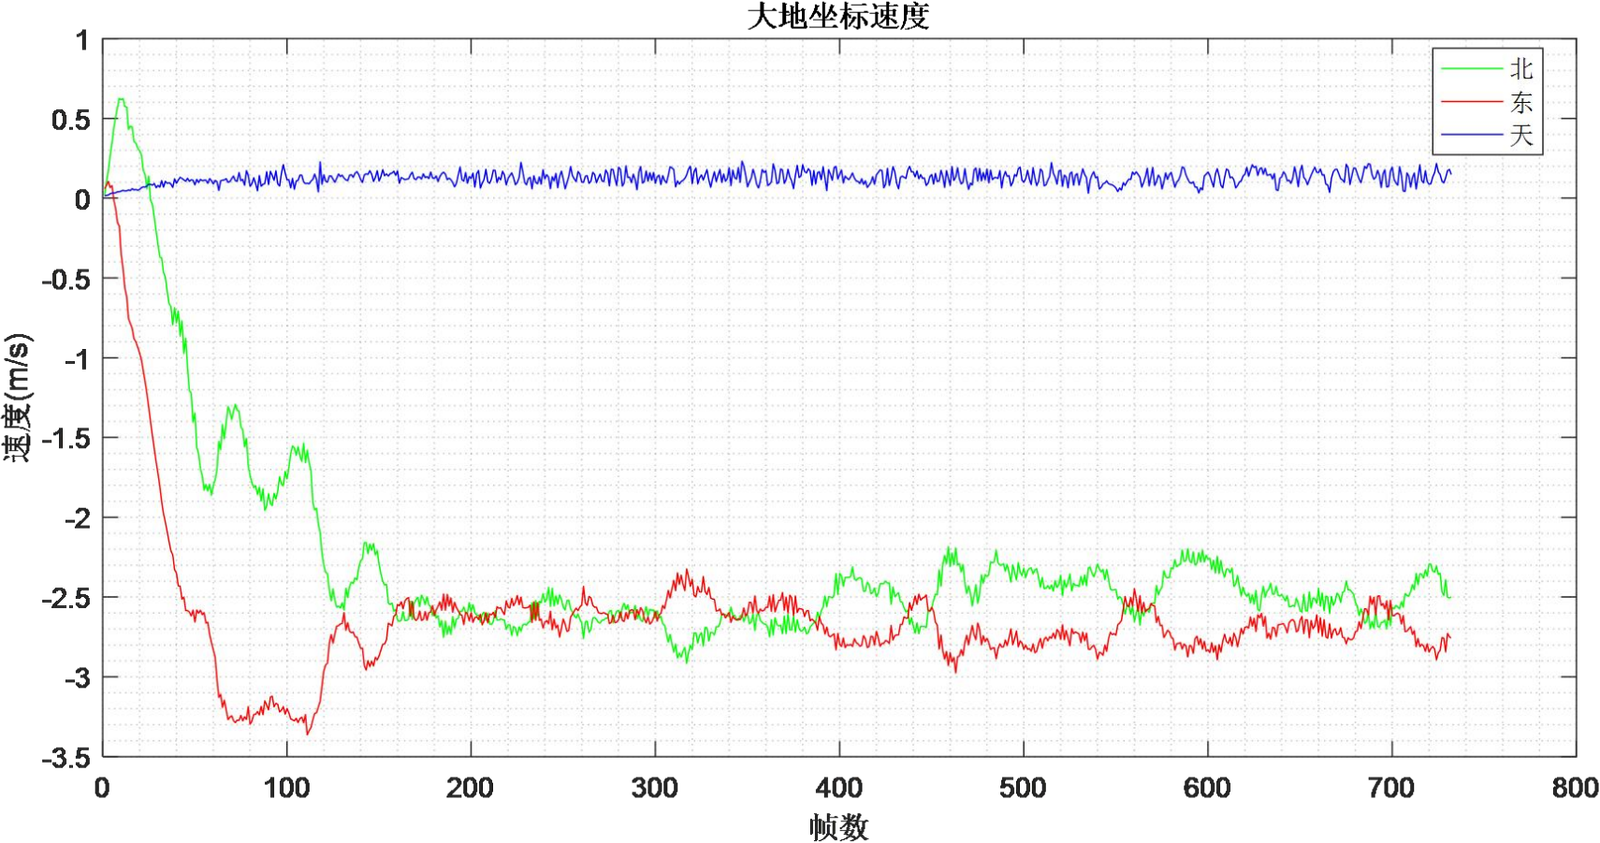
Figure 3.16 Velocity Calculation Results in Earth Coordinates
It can be seen from Figures 3.13 to 3.16 that during Route 2, the velocities calculated by the DVL-600K in beam coordinates, instrument coordinates and Earth coordinates are stable and basically consistent with the actual vessel speed. This proves that the equipment has the capability of stable and accurate velocity measurement.
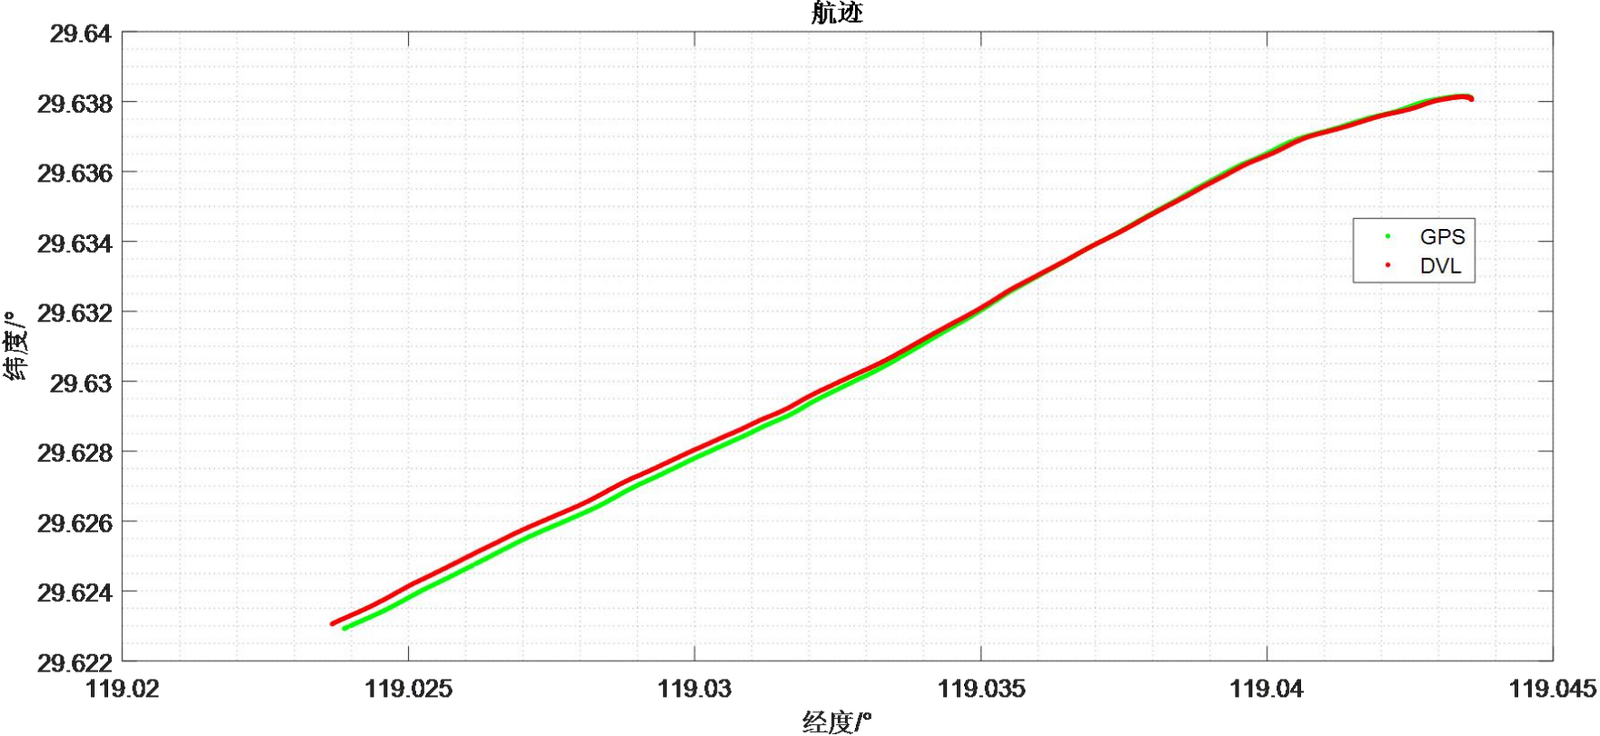
Figure 3.17 Range Comparison Results between DVL and GPS
(3)Route 3
Route 3 lasted approximately 700 seconds, during which the test vessel maintained a speed of about 7–8 knots, with a total range of approximately 3 km.
Throughout the process, the equipment maintained stable lake bottom tracking, stable and accurate speed measurement, and precise range calculation.
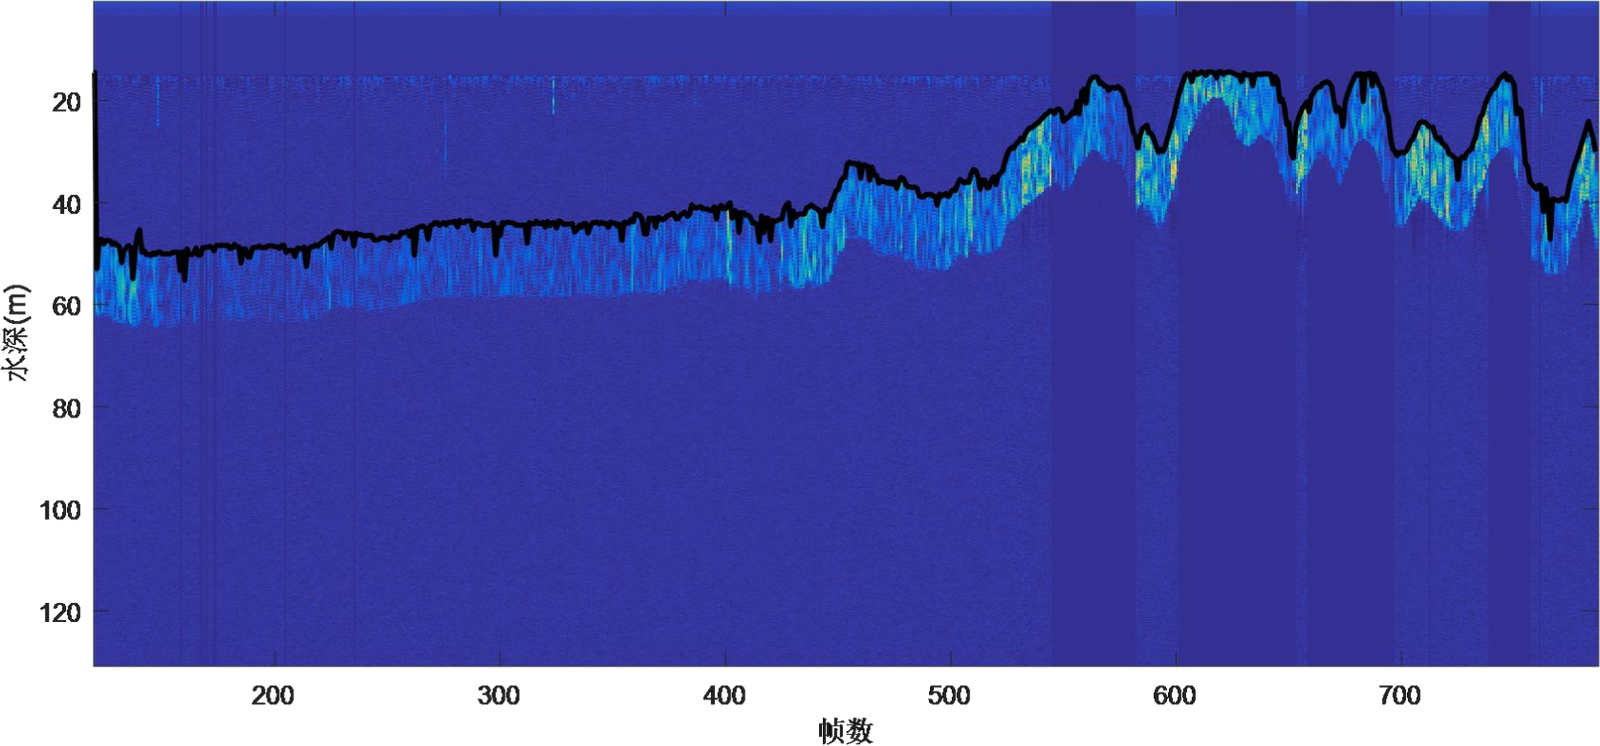
Figure 3.18 Stable Lake Bottom Tracking Results
It can be seen from Figure 3.18 that during Route 3, the lake bottom depth gradually became shallower at first and then fluctuated drastically, varying continuously from 20 m to 55 m. Nevertheless, Equipment 1 still maintained stable bottom tracking, which proves that the equipment is capable of stably tracking complex lake (sea) bottoms.
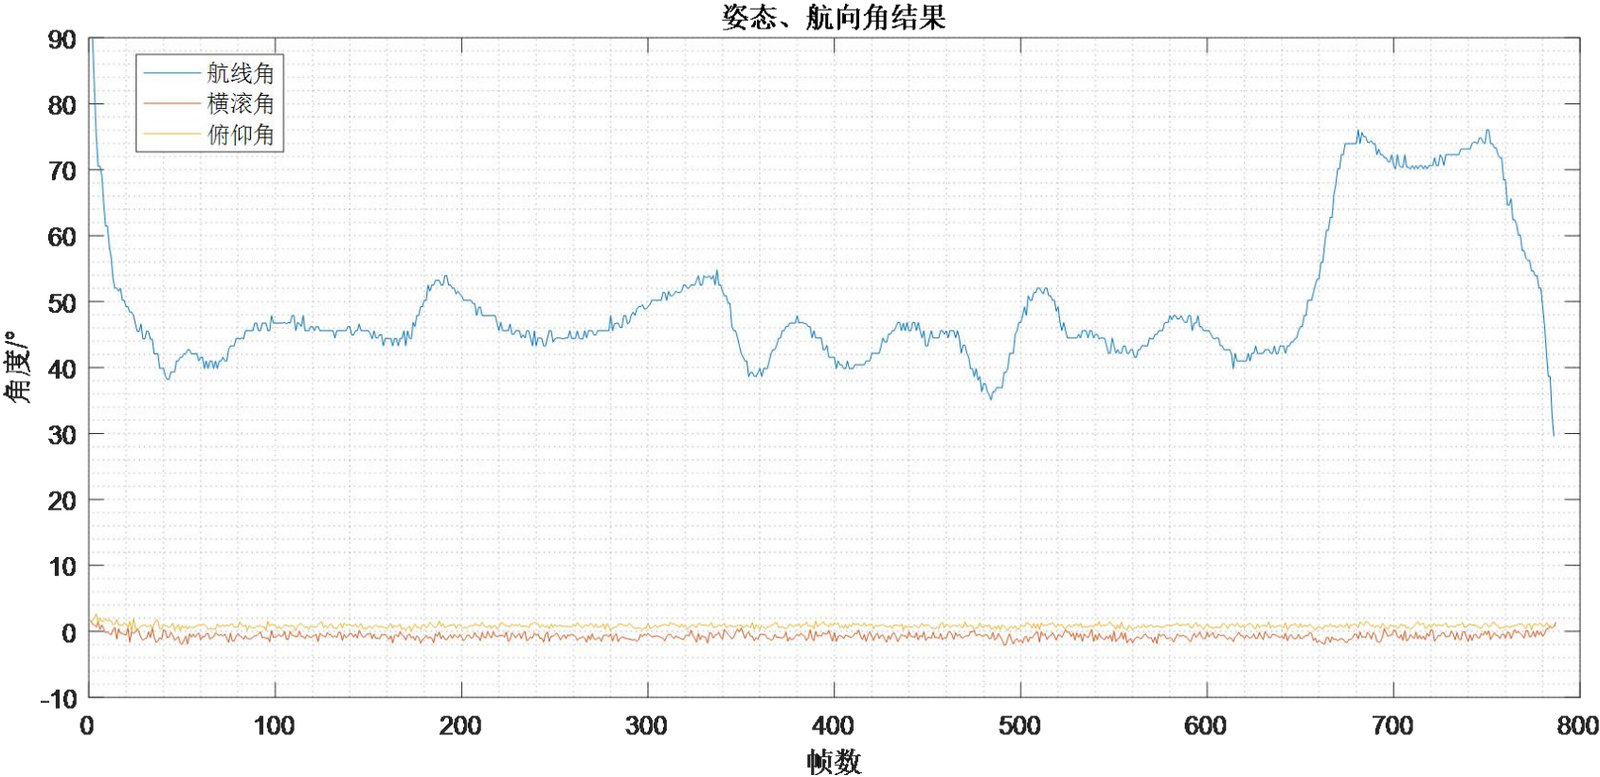
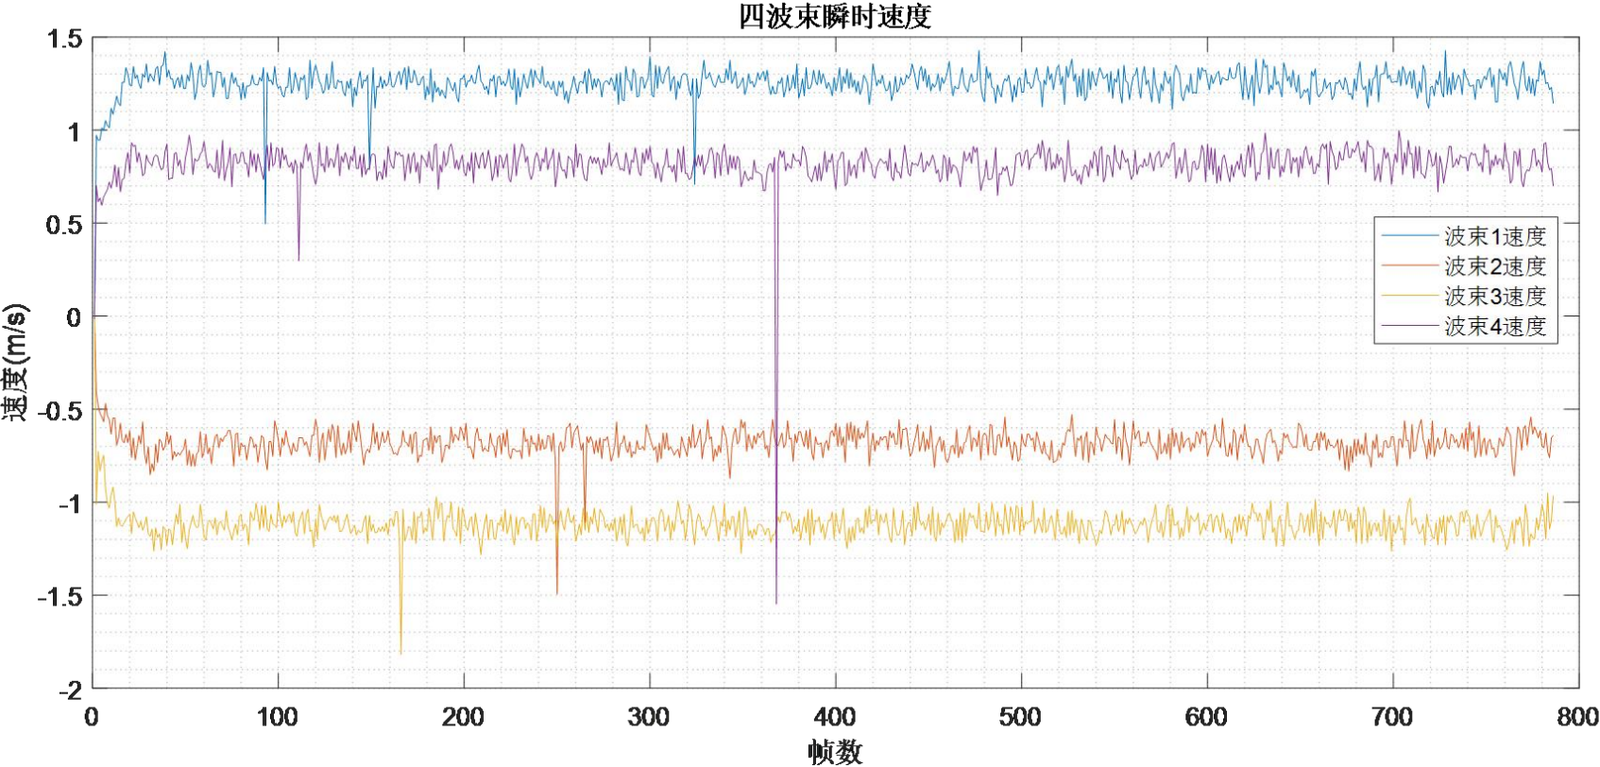
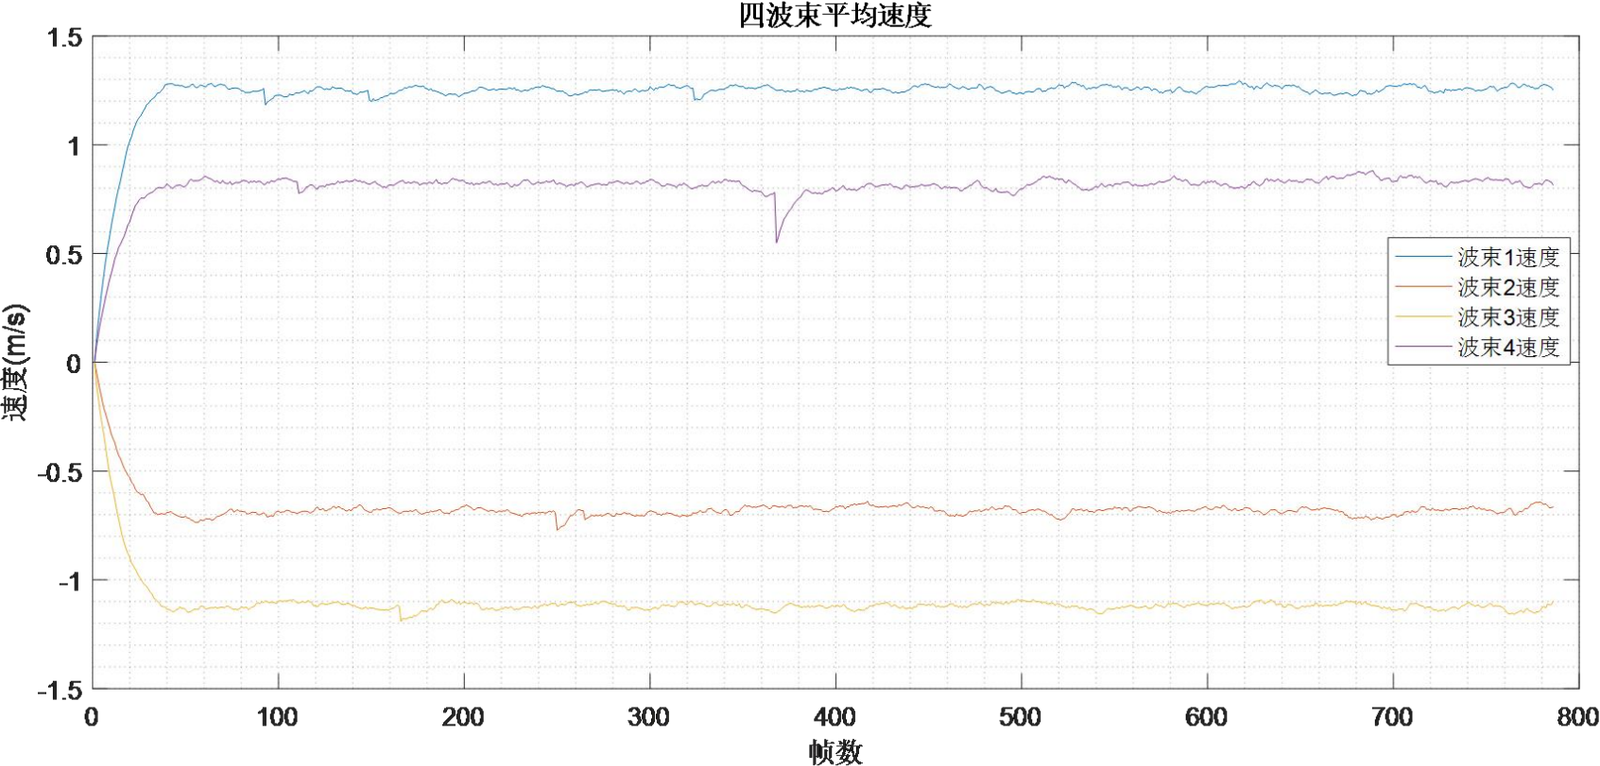
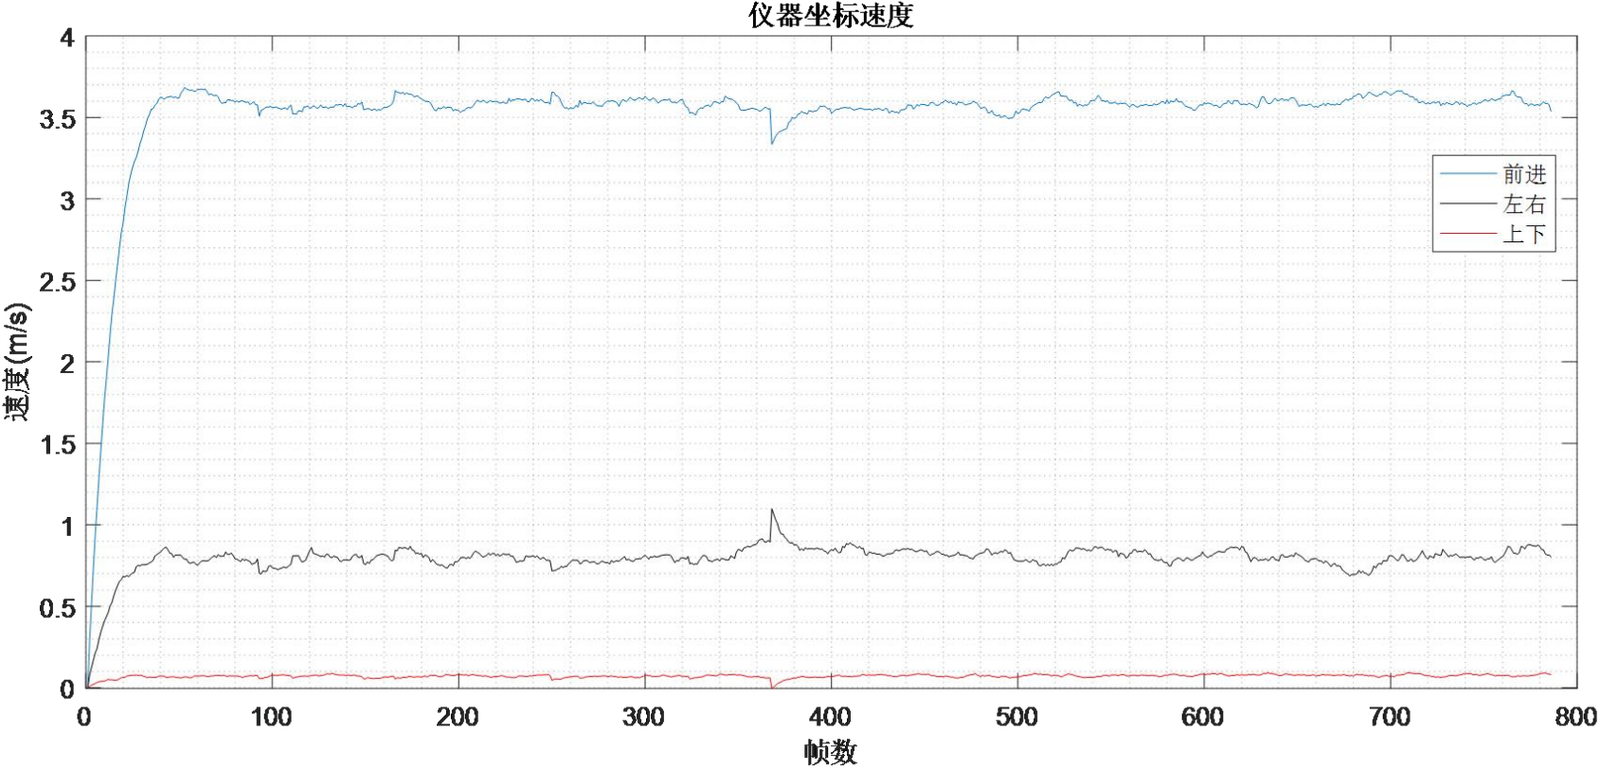
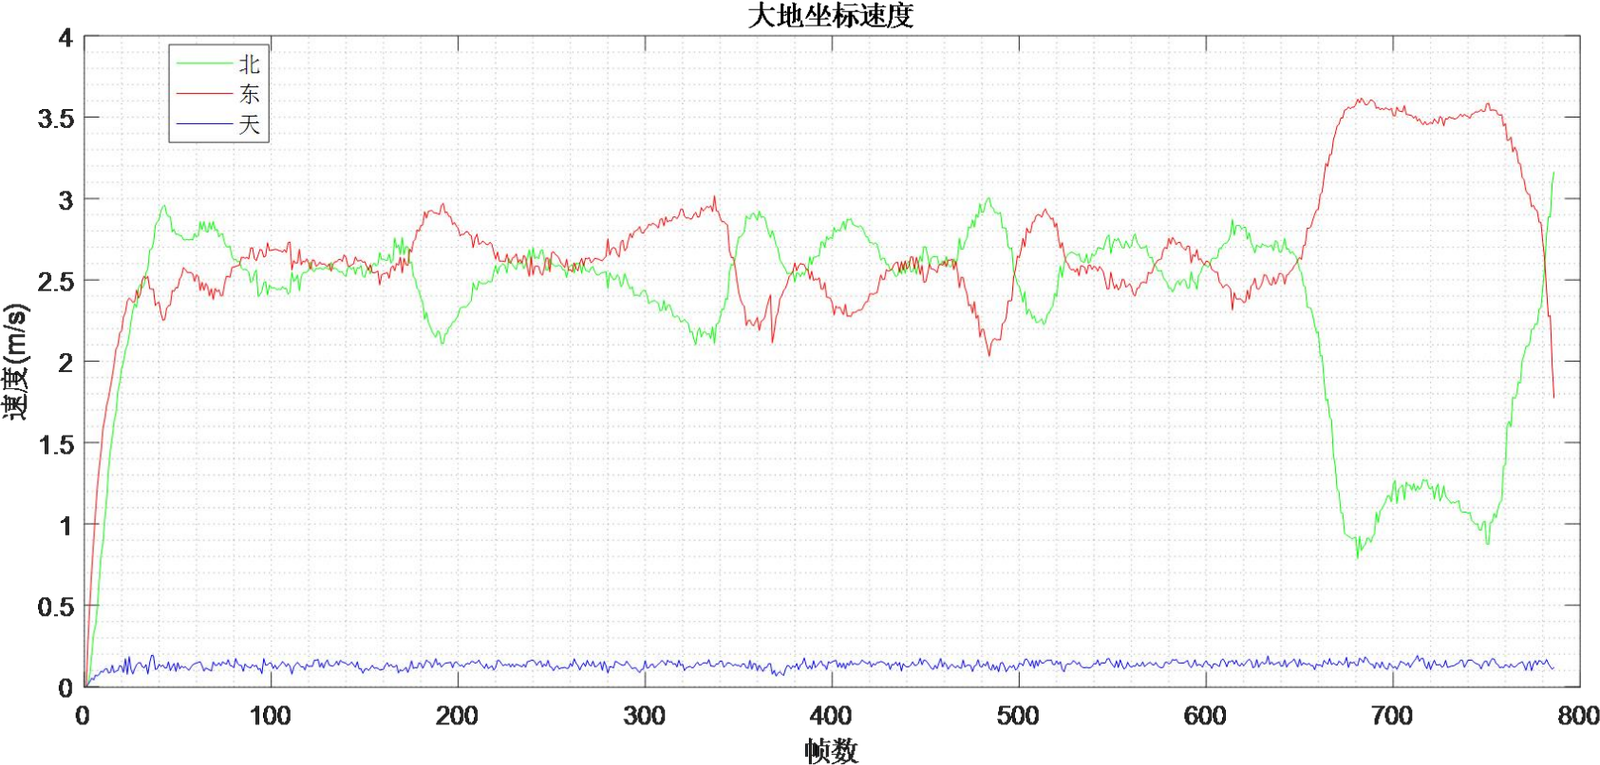
Figure 3.22 Velocity Calculation Results in Earth Coordinates
It can be seen from Figures 3.19 to 3.22 that during Route 3, the velocities calculated by the DVL-600K in beam coordinates, instrument coordinates and Earth coordinates are stable and basically consistent with the actual vessel speed. This proves that the equipment has the capability of stable and accurate velocity measurement.
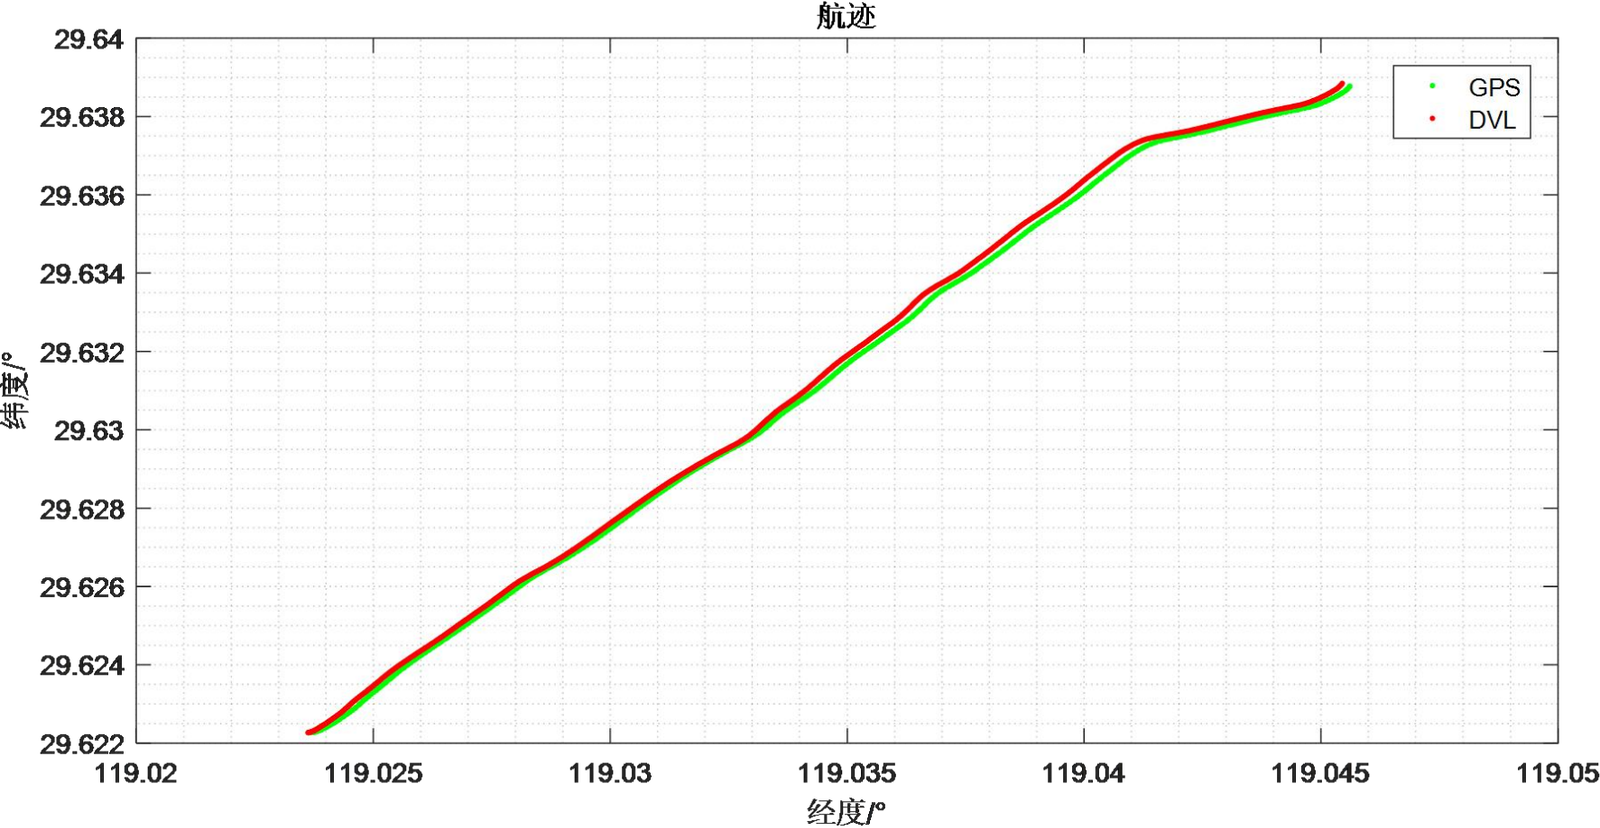
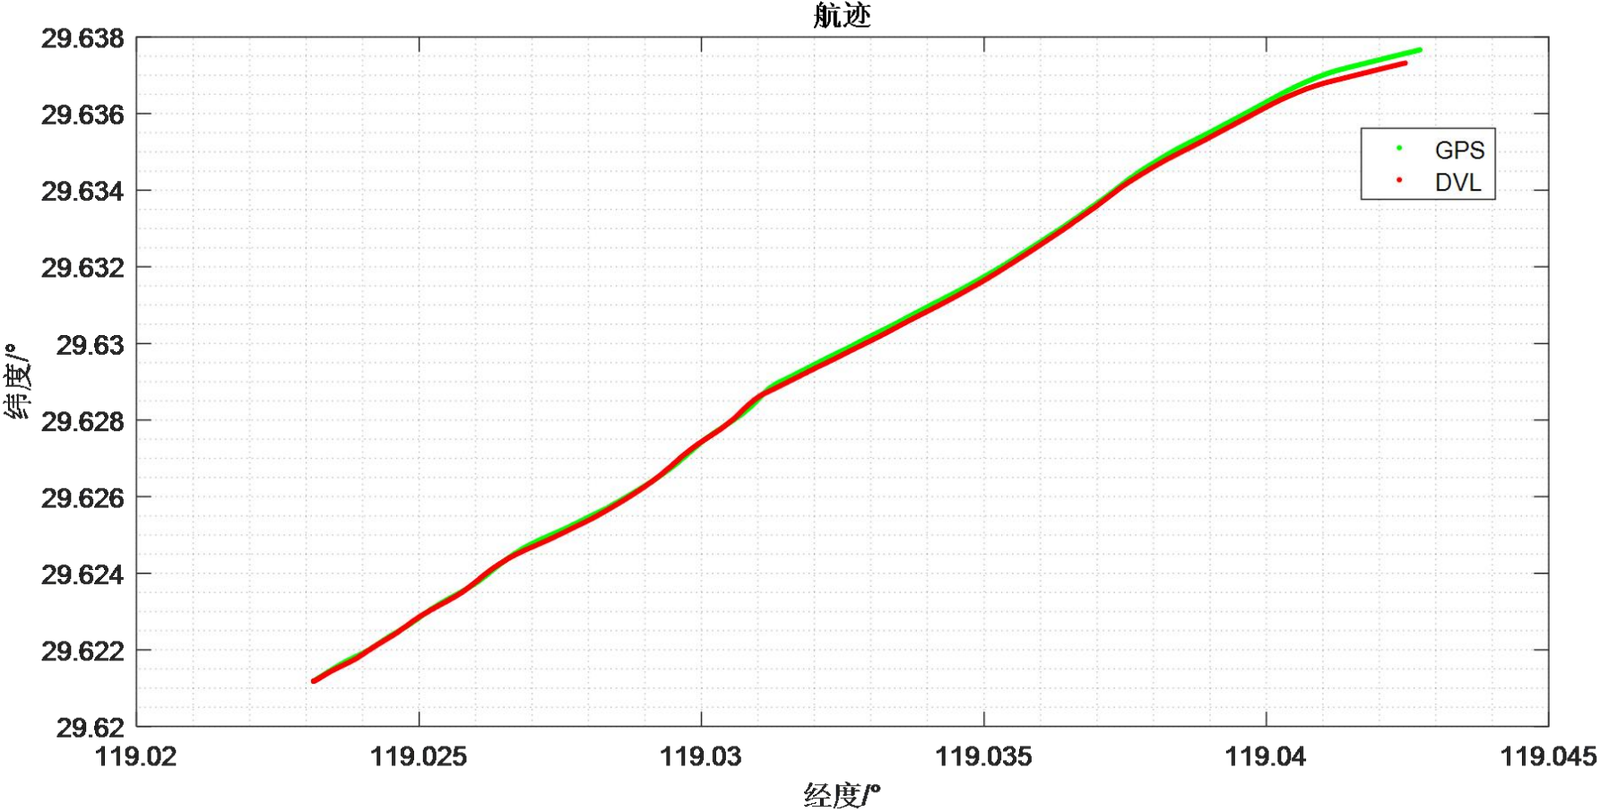
Figure 3.23 Range Comparison Results between DVL and GPS
It can be seen from Figure 3.23 that during Route 3, the range calculated by the DVL-600K (red) is basically consistent with the range recorded by GPS (green). The total range is 2848.1 m, and the end-point deviation between the two is 7.8 m, with a relative error of 2.7‰. This sufficiently proves that the equipment has accurate range calculation capability.
3.3.2 Test Results of Equipment 2
Equipment 2 completed a total of 3 valid routes. During the route test, the equipment parameters were set to automatic mode. The pulse width, transmission power and other parameters were automatically adjusted according to the real-time measured lake bottom depth, resulting in simple and convenient operation.
(1)Route 1
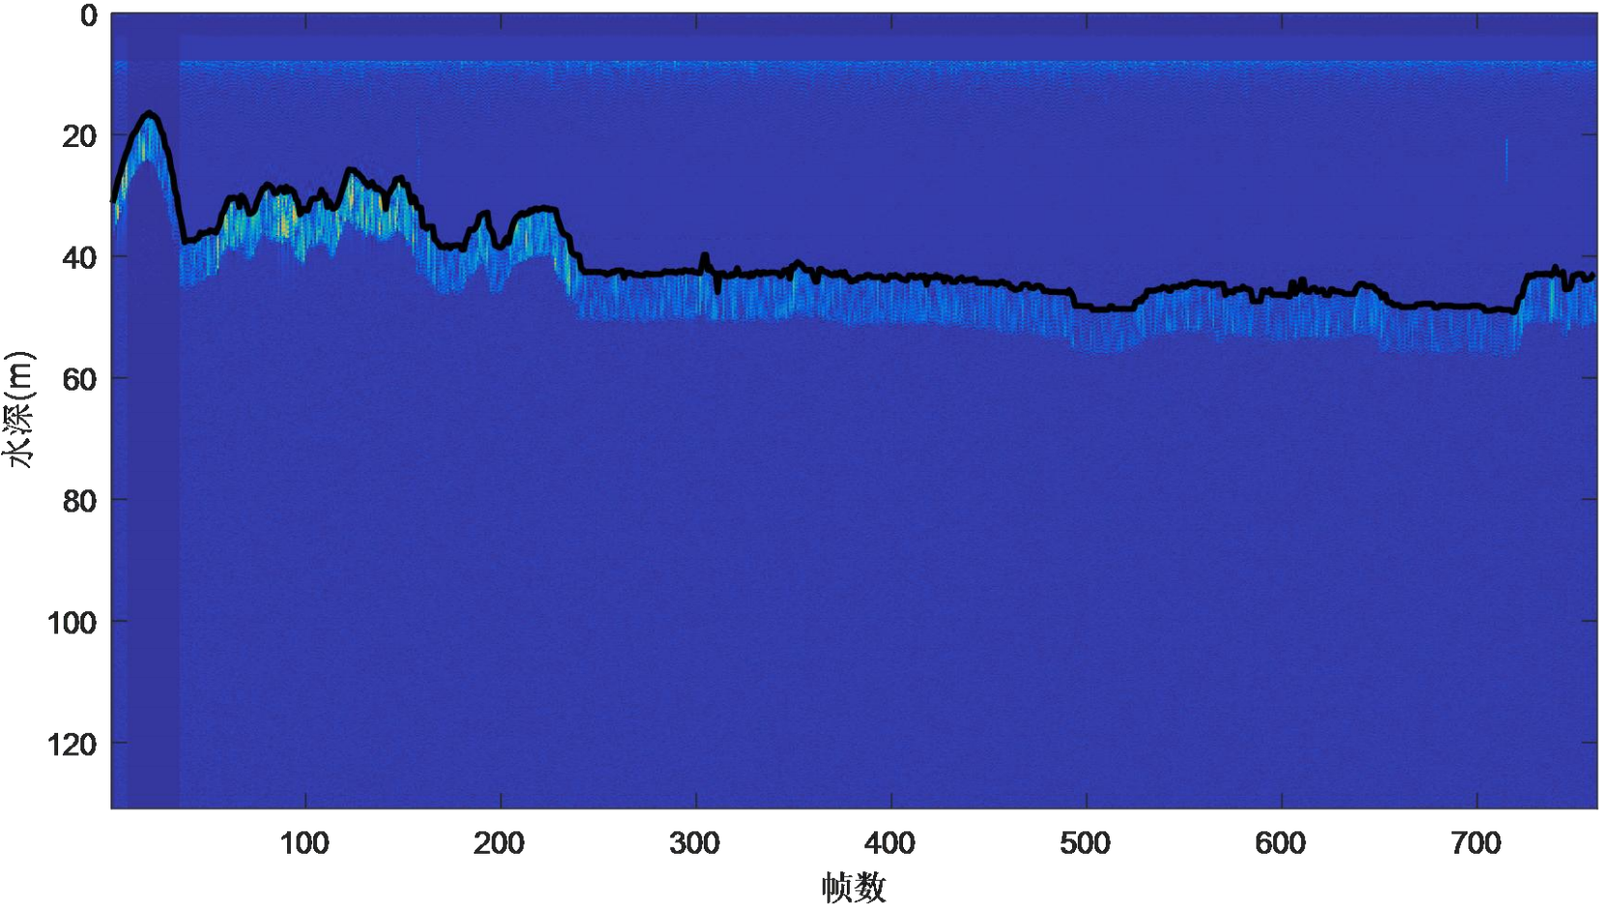
Figure 3.24 Stable Lake Bottom Tracking Results
It can be seen from Figure 3.24 that during Route 1, the lake bottom topography fluctuated relatively drastically, with depths varying continuously from 20 m to 50 m. Nevertheless, Equipment 2 still maintained stable bottom tracking, which proves that the equipment is capable of stably tracking complex lake (sea) bottoms.
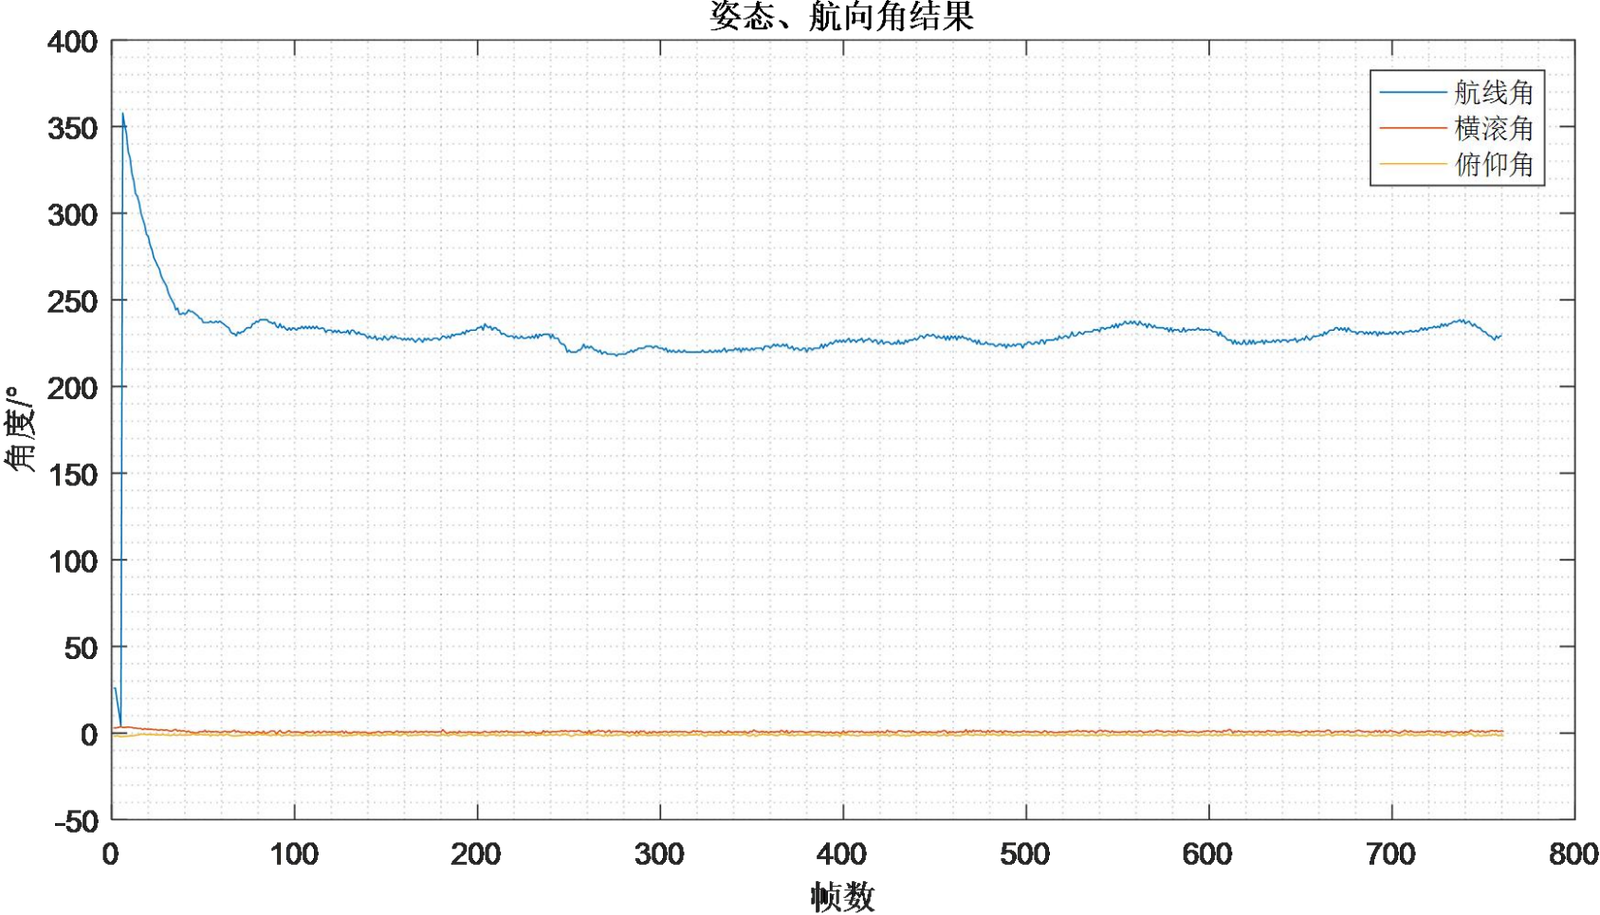
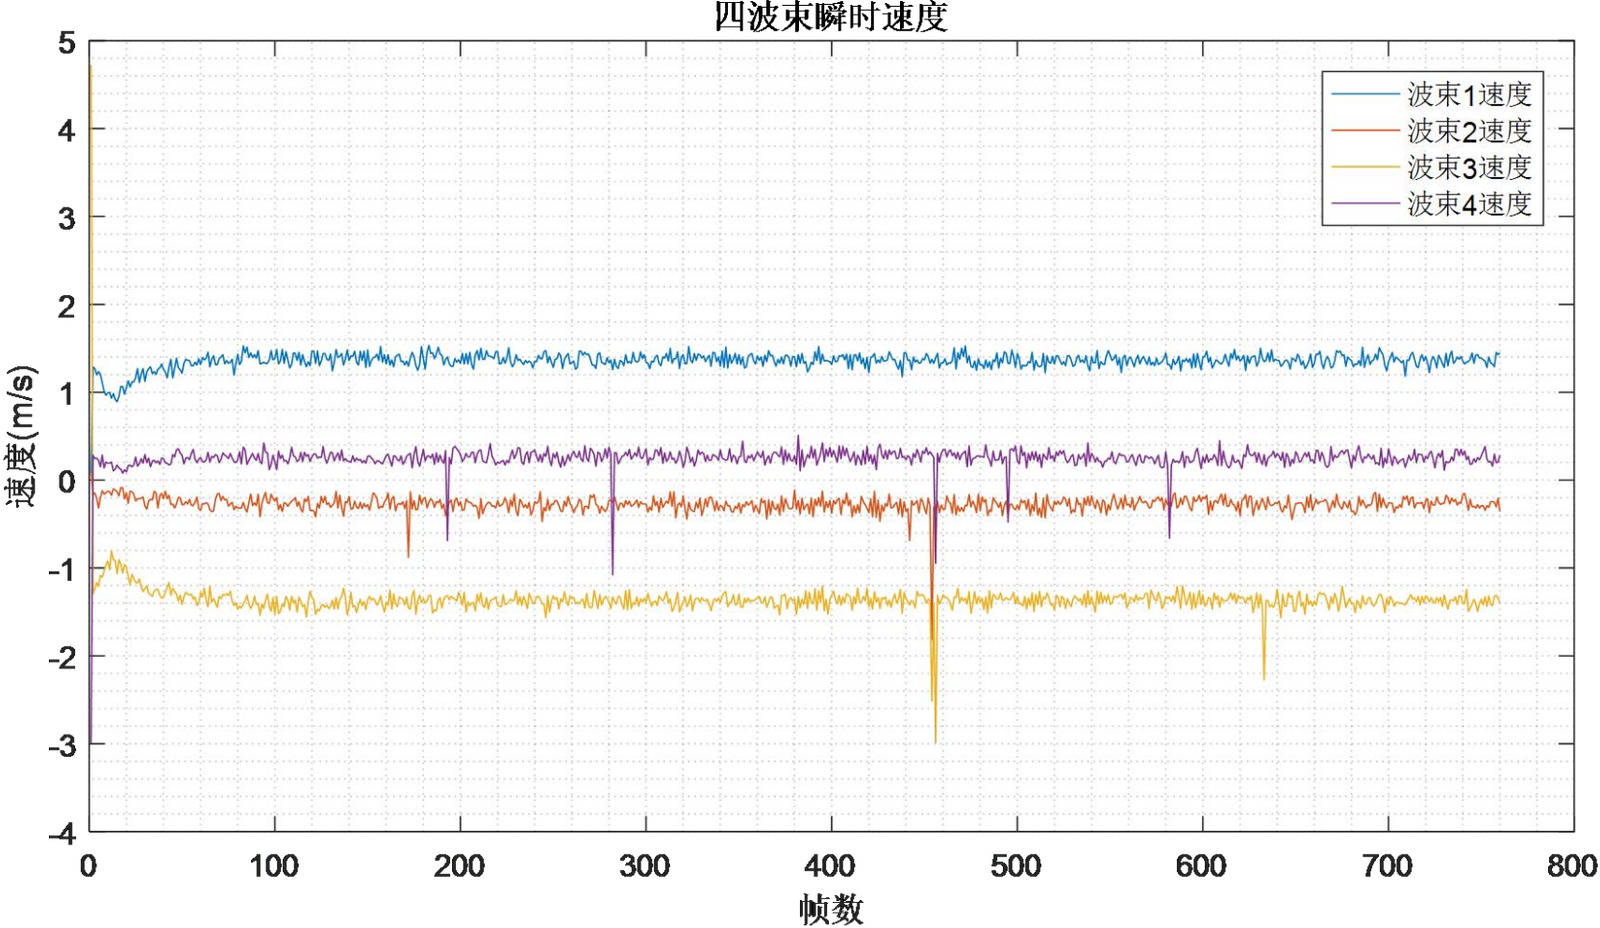
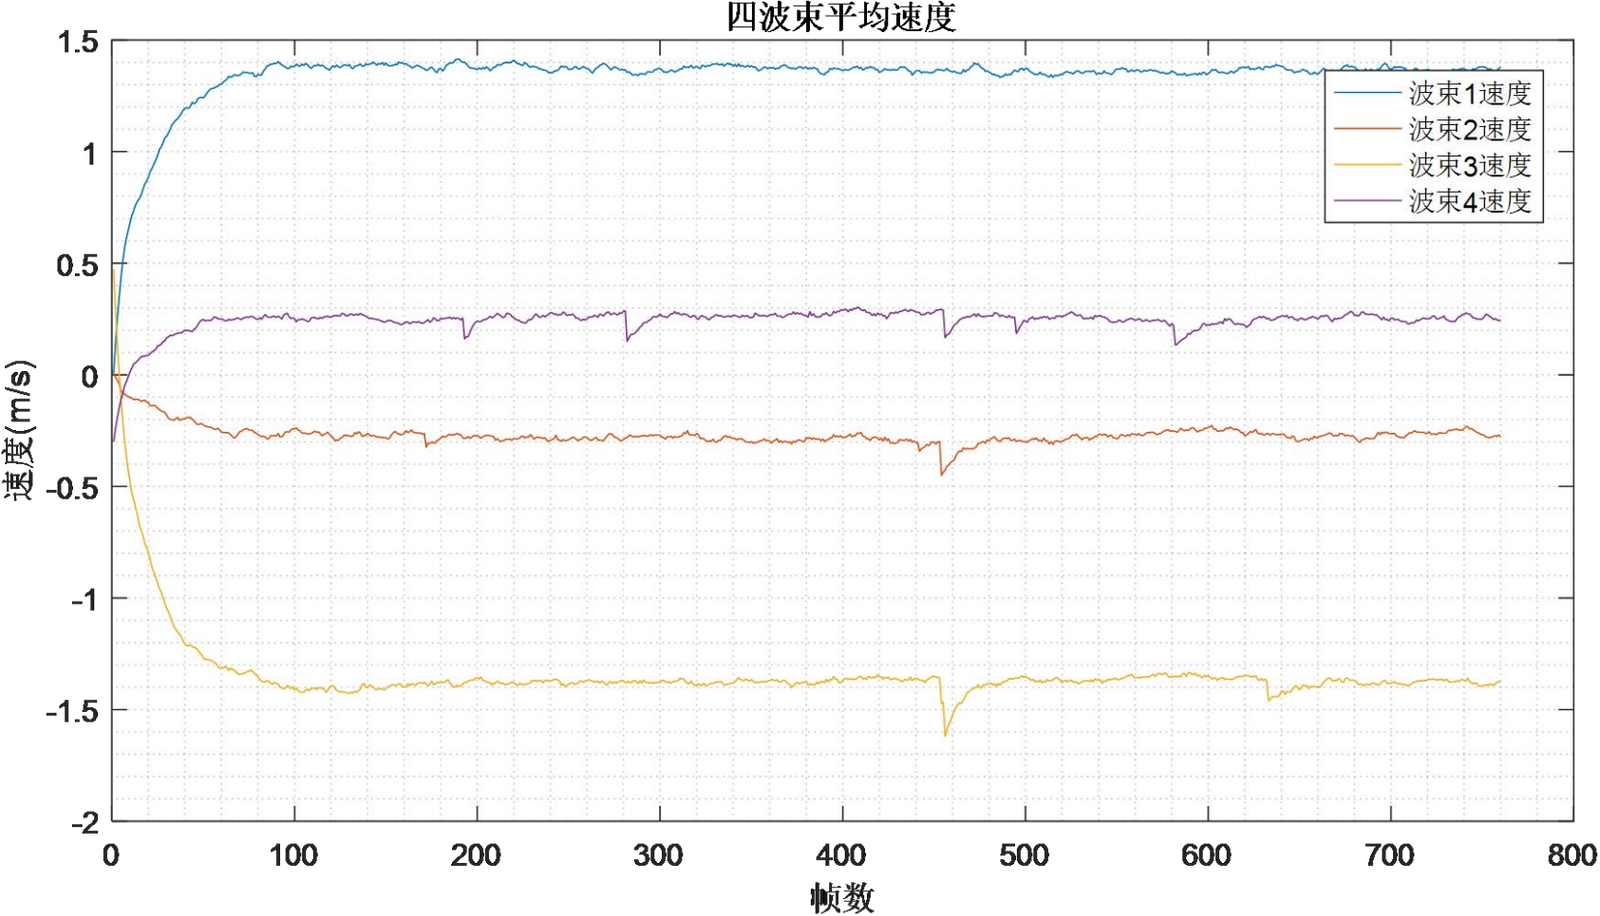
Figure 3.26 Velocity Calculation Results in Beam Coordinates
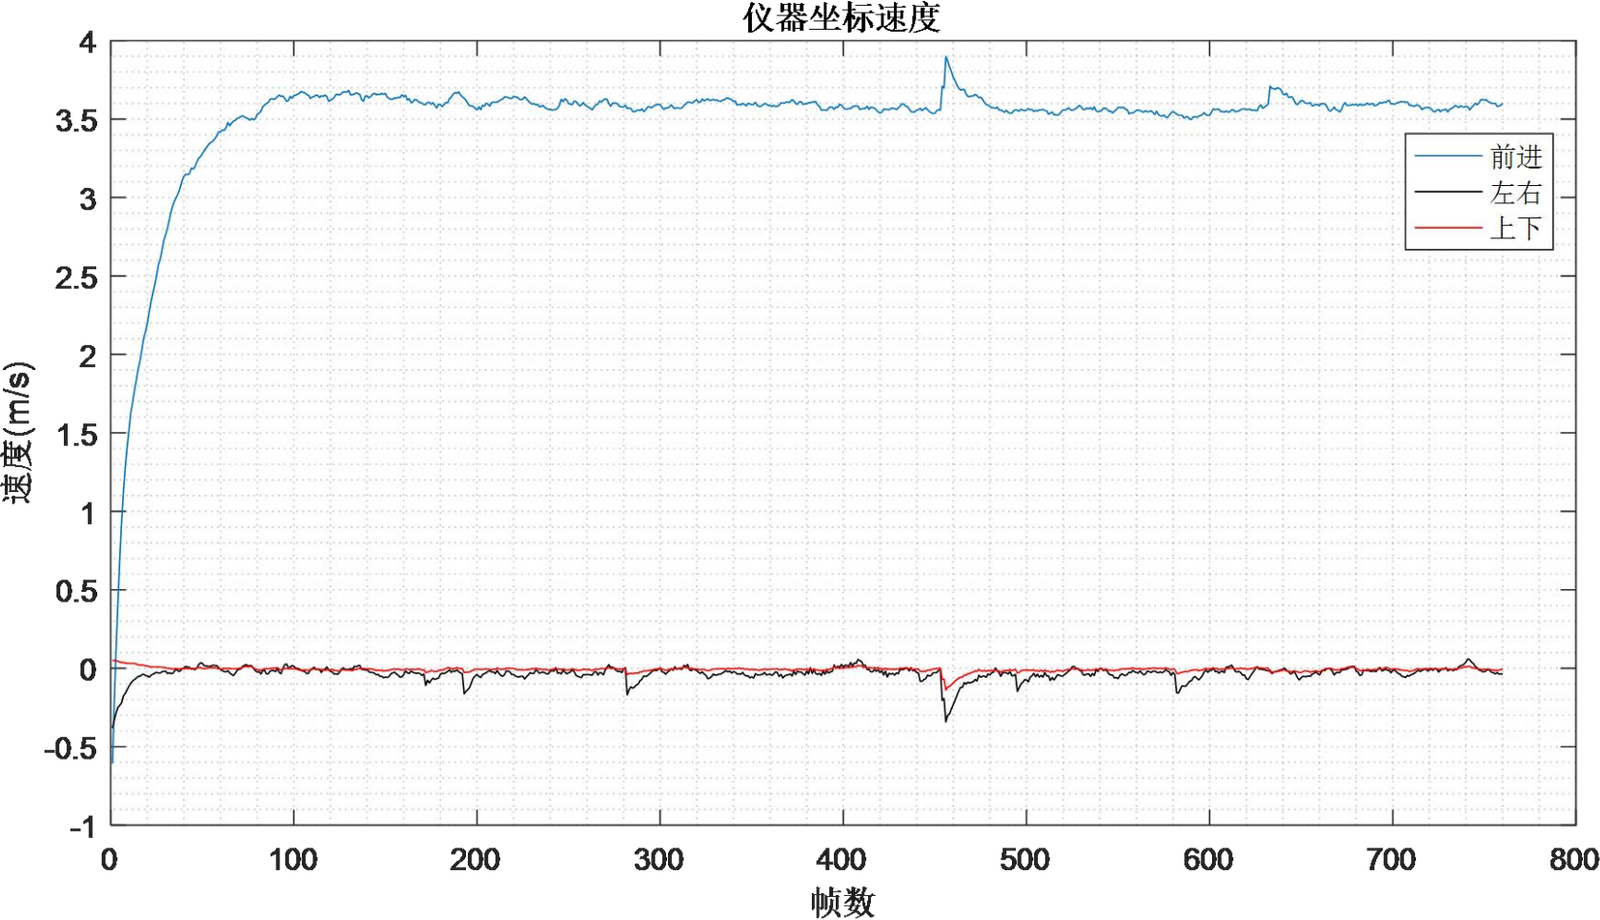
Figure 3.27 Velocity Calculation Results in Instrument Coordinates
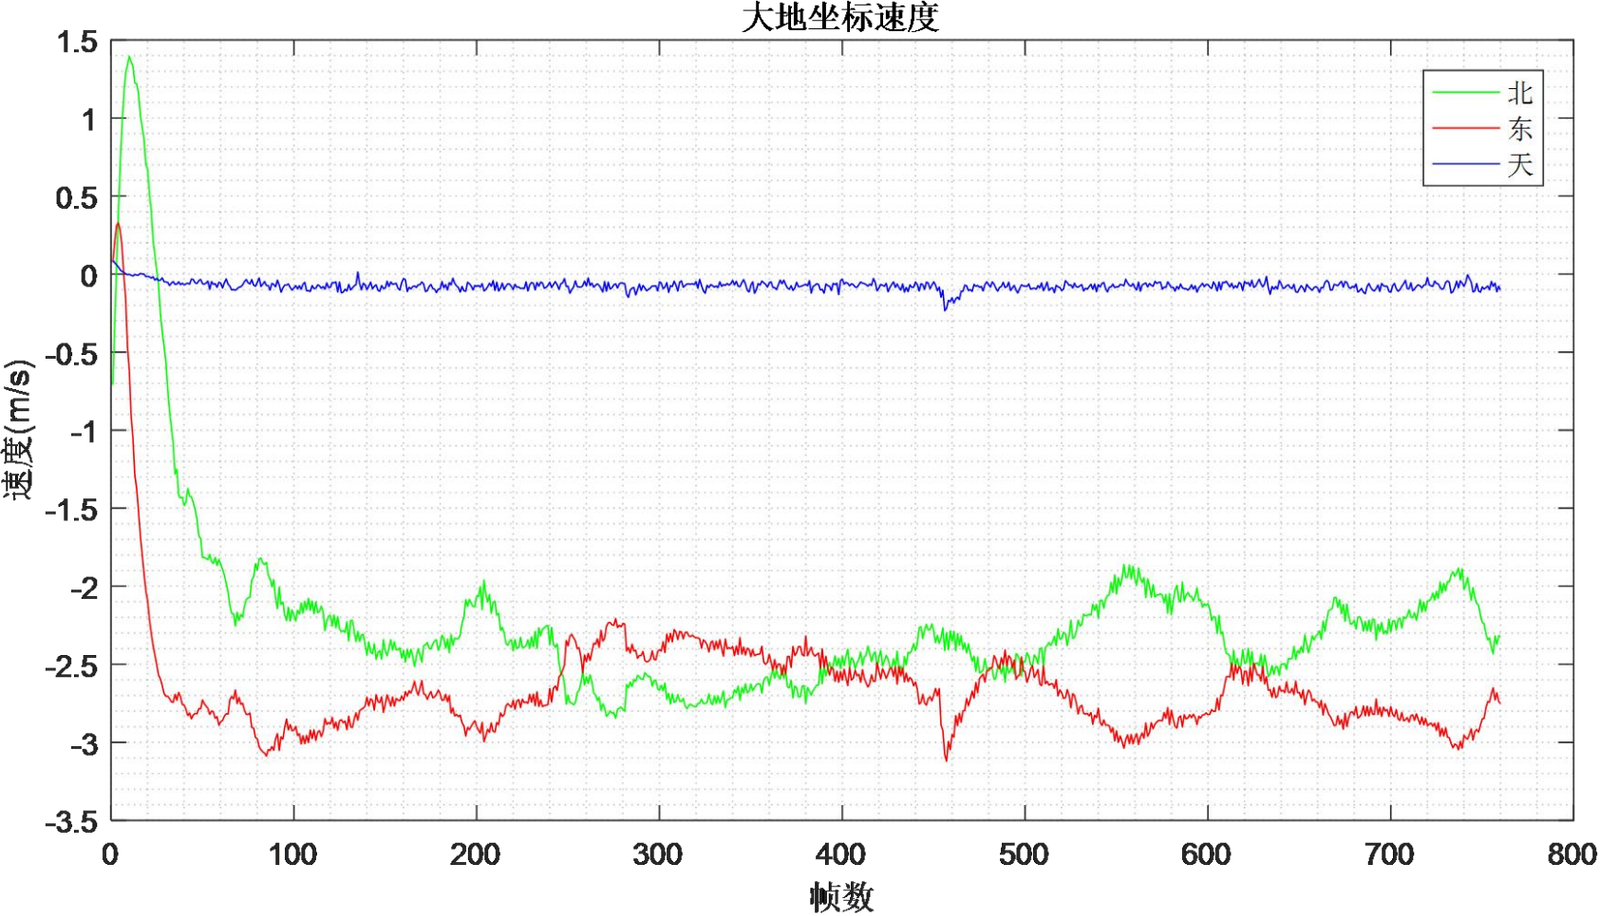
Figure 3.28 Velocity Calculation Results in Earth Coordinates
It can be seen from Figures 3.25 to 3.28 that during Route 1, the velocities calculated by the DVL-600K in beam coordinates, instrument coordinates and Earth coordinates are stable and basically consistent with the actual vessel speed. This proves that the equipment has the capability of stable and accurate velocity measurement.
It can be seen from Figure 3.29 that during Route 1, the range calculated by the DVL-600K (red) is basically consistent with the range recorded by GPS (green). The total range is 2708.2 m, and the end-point deviation between the two is 5.2 m, with a relative error of 1.9‰. This sufficiently proves that the equipment has accurate range calculation capability.
(3)Route2&3
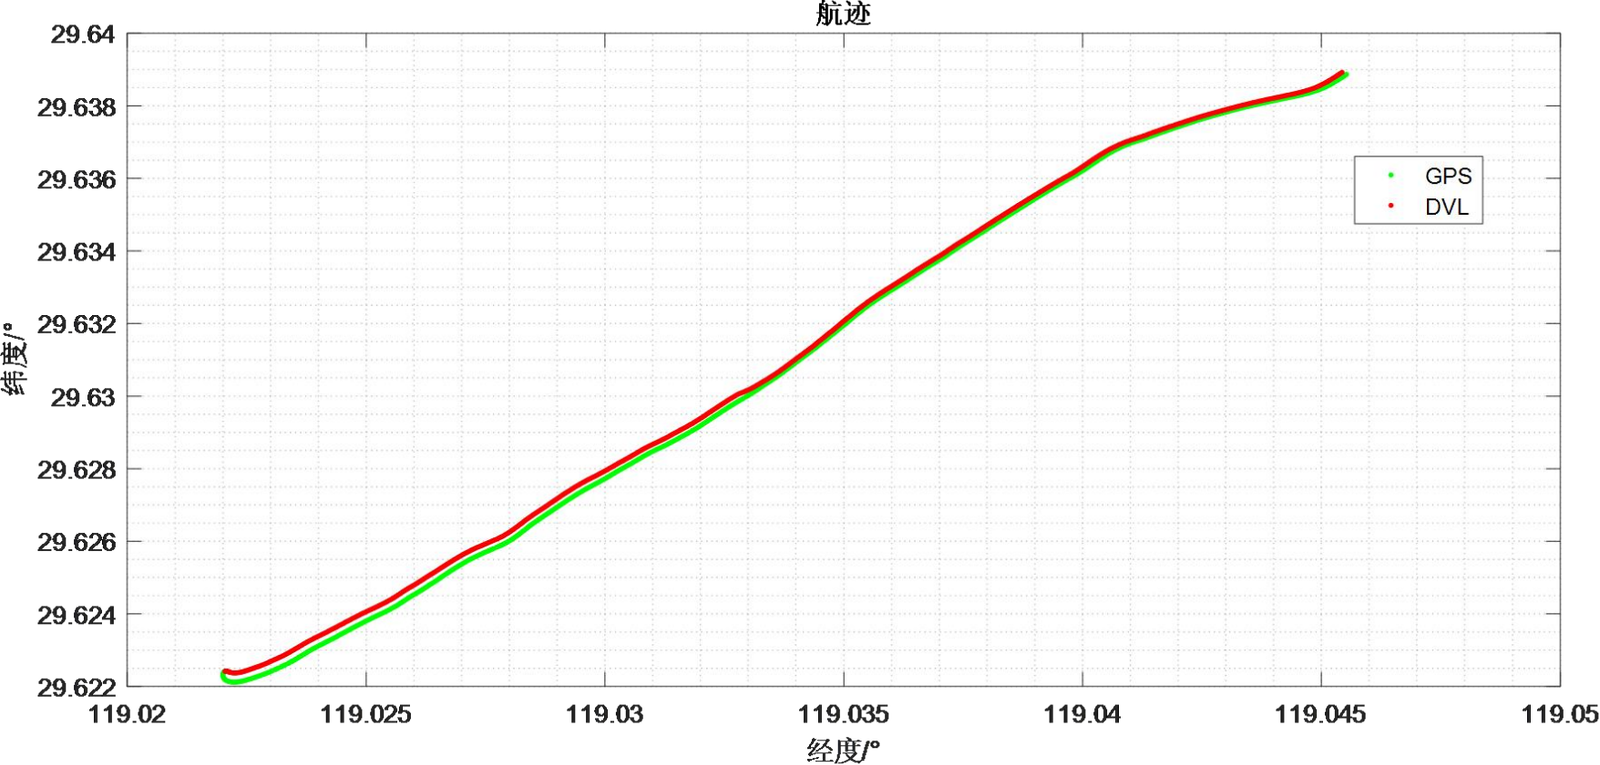
Figure 3.30 Range Comparison Results between DVL and GPS for Route 2
It can be seen from Figures 3.30 and 3.31 that during Route 2 and Route 3, the ranges calculated by the DVL-600K (red) are basically consistent with the ranges recorded by GPS (green).
The total ranges are 2998.2 m and 2656.1 m respectively, with end-point deviations of 5.2 m and 7.5 m, and relative errors of 1.7‰ and 2.8‰ respectively.
This proves that the equipment has accurate range calculation capability.